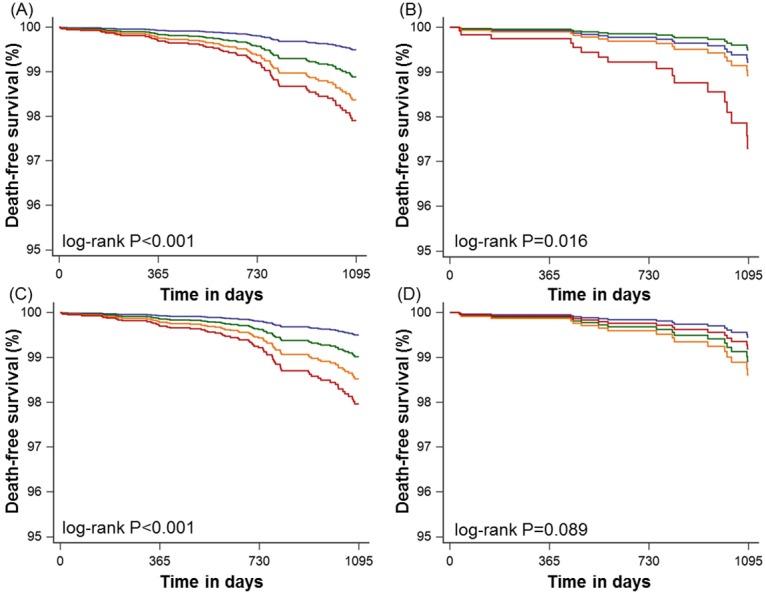
Fig 2. Kaplan-Meier survival curves for all-cause mortality-free survival.

(A) coronary artery calcium score categories for patients without statin therapy, (B) coronary artery calcium score categories for patients with statin therapy, (C) segment involvement score categories for patients without statin therapy, and (D) segment involvement score categories for patients with statin therapy. Blue, green, orange, and red lines indicate 0, 1–99, 100–299, and ≥300 coronary artery calcium score categories. Blue, green, orange, and red lines indicate 0, 1, 2–3, and ≥4 segment involvement score categories.
