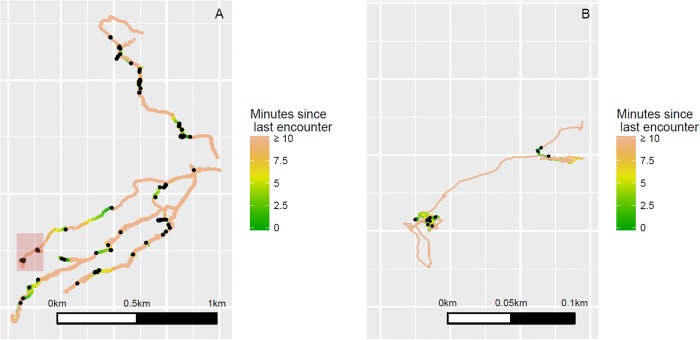
Fig 1. Focal follow GPS recordings of Emberá-Chamí blowgun hunters, spring 2017.
Frame A plots smoothed, low-resolution paths for all hunts in the data set. At this large scale, hunts appear fairly linear. Frame B plots a higher-resolution image of the red-shaded area from Frame A. At this scale, it becomes evident that prey encounters (black points plotted on each respective path) are associated with changes in search style. Note that the paths are colored by time since last encounter with prey. The orange regions, representing search periods at least 10 minutes post-encounter, are mostly linear. The green regions, representing search periods shortly after an encounter, are more tortuous (Frame B).

