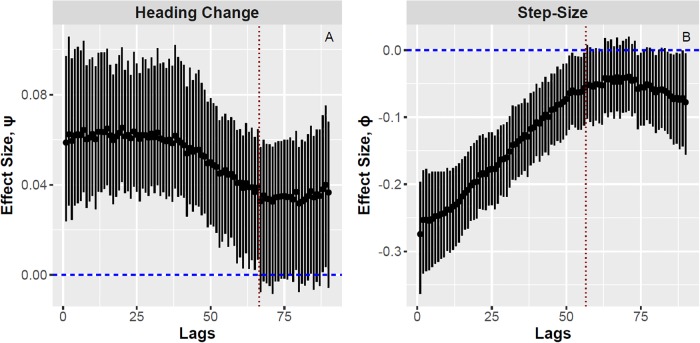
Fig 2. Posterior distributions for the effects of prey encounters on turning-angle and step-size.
Both frames depict medians and 90% credible intervals. Frame A plots ψ[s]—the lagged effects of encounters on turning-angle, and Frame B plots ϕ[s]—the lagged effects of encounters on step-size, for lags s ∈ {1, …, 90}. The horizontal blue lines represent an effect size of zero. We note significant effects of lagged encounters on both turning-angle (positive) and step-size (negative), with effects lasting about 66 time-steps (11 minutes) for turning-angle change, and about 56 time steps (9 minutes) for step-size. The vertical red lines indicate when the confidence regions on the parameters begin to cross zero, the value of no effect.

