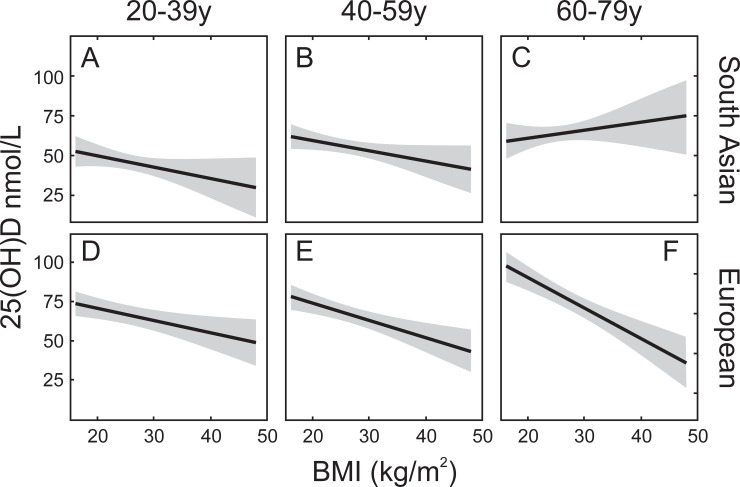
Fig 2. Relationship between serum 25OHD and BMI as a function of age and ethnic background.
Solid line represents the relationship obtained from the regression model with 95% confidence limits (shaded area). Panels A (N = 173, age range 20-39y), B (N = 284, age range 40-59y) and C (N = 125, age range 60-79y) represent data from participants of South Asian descent. Panels D (N = 233, age range 20-39y), E (N = 271, age range 40-59y), and F (N = 147, age range 60-79y) represent data from participants of European descent.

