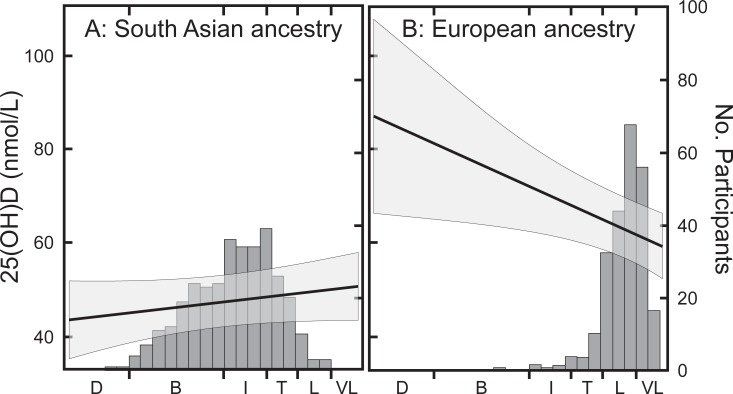
Fig 4.
Serum 25OHD values as a function of skin color for participants of South Asian (Panel A) and European (Panel B) ancestry. The x axis shows skin color classifications corresponding to Individual topology Angles calculated for each individual [21]: D (dark), B (brown), I (intermediate), T (tanned), L (light), and VL (very light). The straight line represents the least squares regression relationship between serum 25OHD values and skin color obtained from the PROC MIXED model (left axis). The shaded area represents the 95% confidence limits. The bars represent the number of participants falling within the indicated skin color range (right axis).

