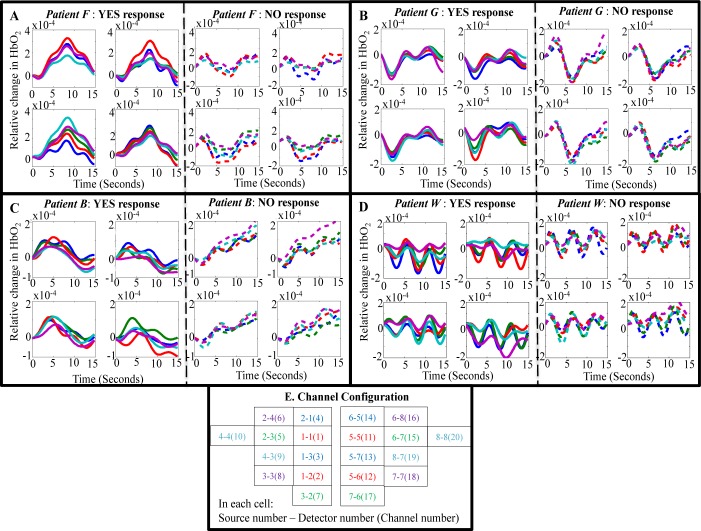
Fig 1. The averaged relative change in O2Hb corresponding to “yes” and “no” sentence interstimuli interval (ISI).
(A) Patient F, (B) patient G, (C) patient B, and (D) patient W. (E) Channel configuration: Eight sources and eight detectors placed on the frontocentral brain region translated into 20 channels, 10 on each side of each hemisphere. For clearly displaying the relative change in O2Hb, 10 channels on each side of hemisphere were further subdivided in groups of 5 channels—i.e., 20 channels were divided into four groups, each consisting of 5 channels. In each subplot, the x-axis is time in seconds and the y-axis is relative change in O2Hb, and the five different colored lines correspond to relative change in O2Hb across 5 different channels, as depicted in the channel configuration map. Fig 1 data is located at https://doi.org/10.5281/zenodo.1419151; https://doi.org/10.5281/zenodo.192386; https://doi.org/10.5281/zenodo.192388; https://doi.org/10.5281/zenodo.192390; https://doi.org/10.5281/zenodo.192391.

