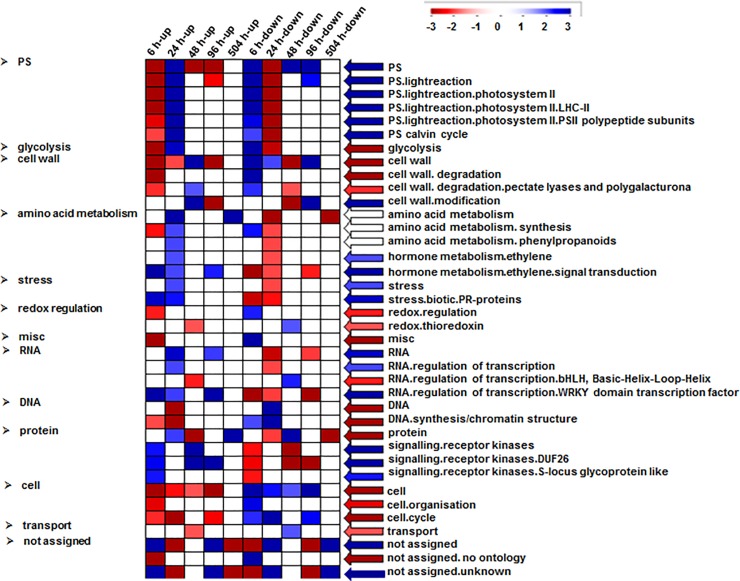
Fig 1. PageMan display of significantly represented functional categories across different time points in response to PEG treatment.
Differentially expressed genes (DEGs) for various time points displaying significant up- and down-regulation were used for the analysis (see materials and methods). The data were subjected to a Wilcoxon test, and the results are displayed as blue-colored bins (significantly over represented), red-colored bins (significantly under represented) and white-colored bin (not significant). Arrow at right side of heatmap represents average level of significance for all the time points. In the figure, non-significant categories have been collapsed to display only significant functional categories. The main functional categories are displayed in the left whereas specific sub-categories are shown in the right.

