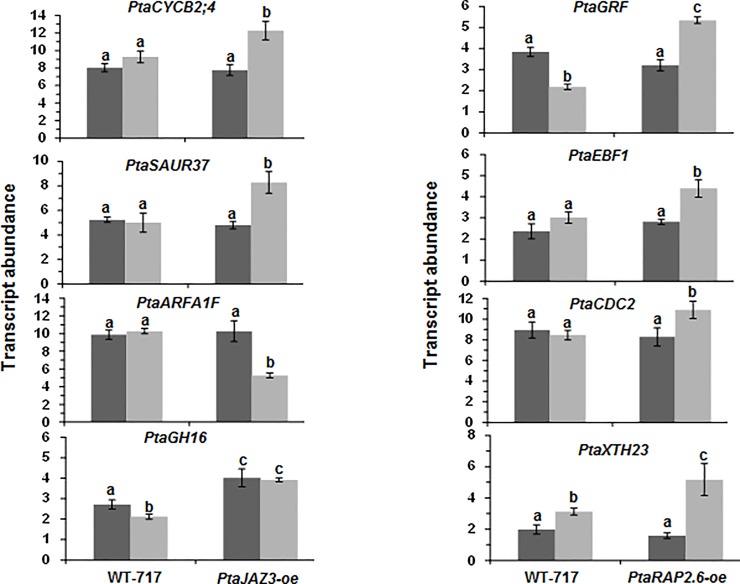
Fig 5. PtaJAZ3 and PtaRAP2.6 overexpression affects transcript abundance of the respective hub genes in response to PEG treatment.
Transcript abundance was analyzed in roots of WT-717, PtaJAZ3-oe (left) and PtaRAP2.6-oe (right) transgenic lines under both control and PEG conditions. Hub genes associated with PtaJAZ3 and PtaRAP2.6 are shown in the left and right graph panels respectively. Two independent lines (four replicates per line) were used for each transgenic modification. Values show genotypes’ mean ± SEM (n = 2). Different letters represent means that are statistically different (P< 0.05) as determined by a one-way ANOVA followed by Tukey’s multiple range tests.

