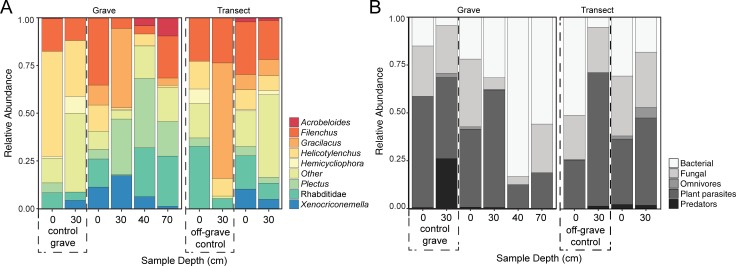
Fig 4. Nematode relative abundance and trophic groups by depth.
(A) Relative abundances are based on taxa found in at least 50% of all soil samples. (B) Relative abundances of trophic groups are presented for all nematode taxa. Control grave (excavated, but no donors) and off‒grave controls (undisturbed site) are included for comparison. No taxa were recovered from the 85‒90 cm depth soils below the grave.

