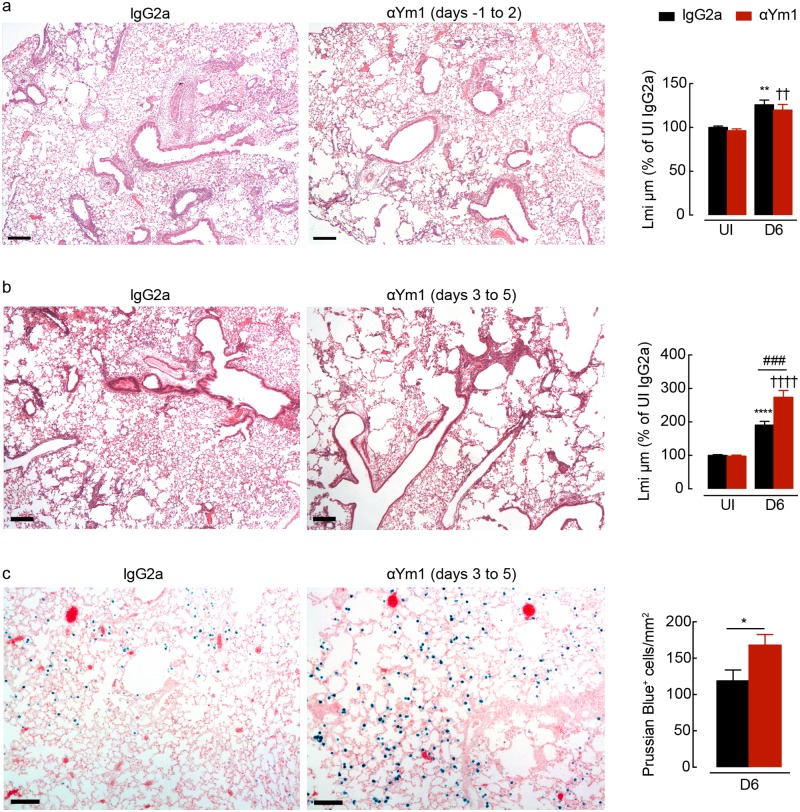
Fig 4. Adaptive Ym1 is required for rapid repair of the lung following helminth infection.
(a) Microscopy of lung sections from mice uninfected or N. brasiliensis (500 L3’s) infected mice (day 0) treated intraperitoneally with anti-Ym1 or IgG2a (days -1 to +2) and collected at day 6, stained with hematoxylin and eosin (images are representative of n = 6, scale bars, 200μm; graph shows quantification of lung damage as linear means intercept (Lmi), data normalised to average Lmi in uninfected IgG2a treated mice, n = 6 per group; data are shown as mean ± sem; two-way ANOVA with Sidak multi-comparison test; **P<0.01 compared to UI IgG2a treated; ✝✝ P<0.01 compared to UI anti-Ym1; data representative of 2 independent experiments). (b) Microscopy of lung sections from mice uninfected or N. brasiliensis infected mice (day 0) treated intraperitoneally with anti-Ym1 or IgG2a (days 3 to 5) and collected at day 6, stained with hematoxylin and eosin (images are representative of n = 6, scale bars, 200μm; graph shows quantification of lung damage as linear means intercept (Lmi), data normalised to average Lmi in uninfected IgG2a treated mice, n = 6 per group; data are shown as mean ± sem; two-way ANOVA with Sidak multi-comparison test; ****P<0.0001 compared to UI IgG2a treated; ✝✝✝✝ P<0.0001 compared to UI anti-Ym1; ###P<0.001 IgG2a infected compared to anti-Ym1 infected mice; data representative of 3 independent experiments). (c) Microscopy of lung sections from mice as in b, stained with prussian blue. Graph shows quantification of the number of prussian blue positive cells per area of lung. (images are representative of n = 6, scale bars, 100μm, n = 6 per group; data are shown as mean ± sem; unpaired t test, *P<0.05; data representative of 3 independent experiments).

