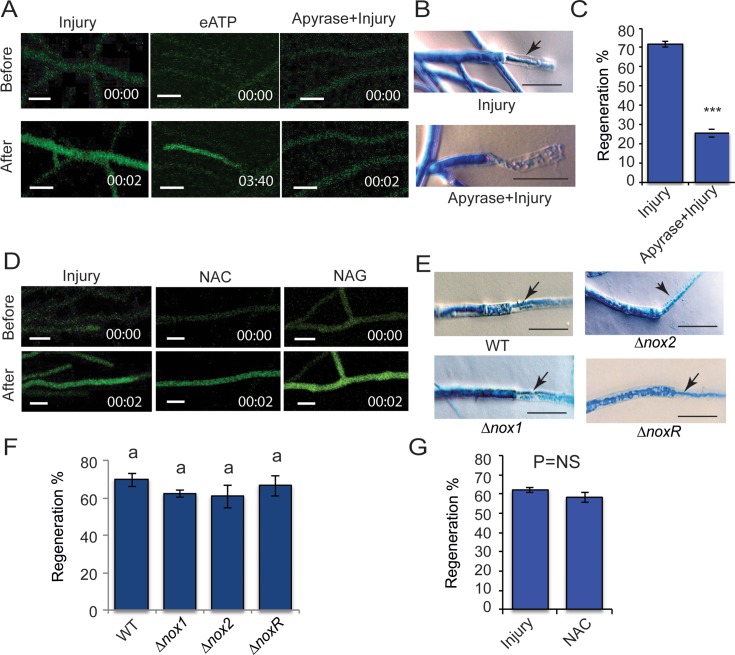
Fig 3. Role of eATP and ROS in Ca2+ influx and regeneration.
A & D. Live-cell imaging of the T. atroviride WT strain carrying pEM12 treated with 100 μM ATP (eATP) or apyrase and then injured (A) or 30 mM NAC or NAG and then damaged (D), the WT strain subjected only to injury was used as a control. Images were obtained using time-lapse confocal microscopy whilst applying the treatment. Scale bar = 10 μM. Time shown in minutes. B & E. Microscopic changes observed after injury. The photographs in B show the response of the WT strain upon injury or treatment with apyrase for 15 min and then damaged. The images in E show the response of the Δnox1, Δnox2 and ΔnoxR mutants upon damage. Hyphae were stained with lactophenol cotton blue and examined by light microscopy. Arrows point to the new regenerating hyphae. Scale bar = 10 μM. C. The graph shows the percentage of hyphae of the wild type strain that regenerate upon injury or apyrase treatment prior to injury. G. The graph shows the percentage of hyphae of the WT strain that regenerate upon injury and those that regenerate when injured after exposure to 30 mM NAC (NAC). C & G. Bars represent the mean ± s.e.m. A t-test was performed, with a significant (P < 0.001***) or non-significant (P = NS) difference. F. The graph shows the percentage of hyphae in the Δnox1, Δnox2 and ΔnoxR mutants that regenerate upon injury. Bars represent the mean ± s.e.m. A one-way ANOVA was used. There was no significant difference between treatments (P < 0.05) as indicated by P = NS. C, F & G. Three independent experiments were performed for each treatment, counting 50 hyphae in each case. There was no difference between treatments (P < 0.05) as indicated by P = NS.

