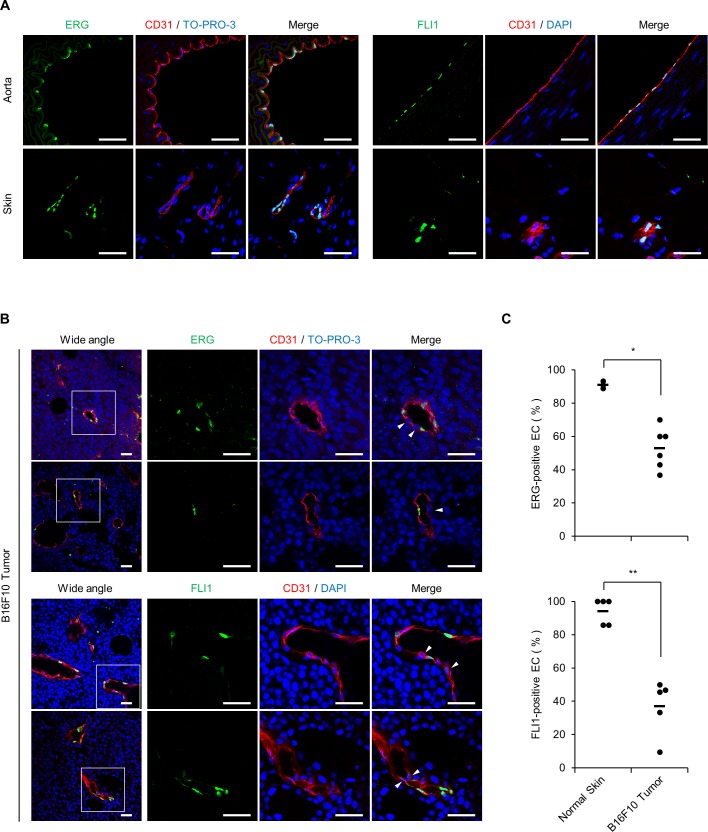
Fig 5. ERG and FLI1 expression is downregulated in intratumoral ECs.
(A) Representative immunofluorescent staining of normal ECs in aorta and skin. Endothelial marker CD31, red; ERG and FLI1, green; nuclei, blue. (B) Representative immunofluorescent staining of ECs in B16F10 tumor tissues. Endothelial marker CD31, red; ERG and FLI1, green; nuclei, blue. The boxed region in the left image is magnified in the right three images. Arrows indicate ERG- or FLI1-negative ECs. (C) Quantification of ERG-positive or FLI1-positive CD31+ ECs. Each plot shows positive ratios in a single image and the horizontal line shows the average. *P < 0.05; **P < 0.01 by Mann-Whitney U test. Immunofluorescent staining was reproduced in at least 5 independent mice. Scale bar, 250 μm. See also S11 Fig.

