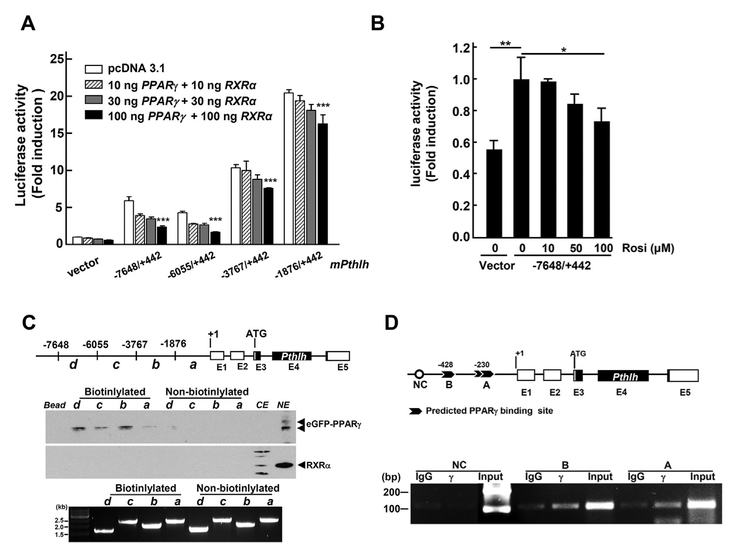
Fig. 3.
PPARγ binds to Pthlh promoter regions as repressor. (A) Pthlh-luciferase activity analyzed after transfection of different sizes of pGL3-Pthlh-promoter constructs with plasmid expressing PPARγ or RXRα proteins in the MLE-15 cells. (B) Pthlh-luciferase activity analyzed after transfection with pGL3-Pthlh-promoter constructs (−7648/+442) with different concentrations of rosiglitazone, a PPARg agonist in the MLE-15 cells. (C) MLE-15 cells were transfected with plasmids expressing eGFP-PPARγ or RXRα protein and then, nuclear proteins were incubated with DNA fragments from the Pthlh promoter and subjected to Western blotting. The bottom gel shows PCR amplicons for the study. a, b, c, d: DNA fragment covering different areas used in pull down assays. CE: cytosolic extract, NE: nuclear extract. (D) PPRE sites were monitored by ChIP assay. Predicted PPRE sites were analyzed using Genomatix software (www.genomatix.de). γ, PPARγ binding site; NC, negative control. ***, p < 0.0001.

