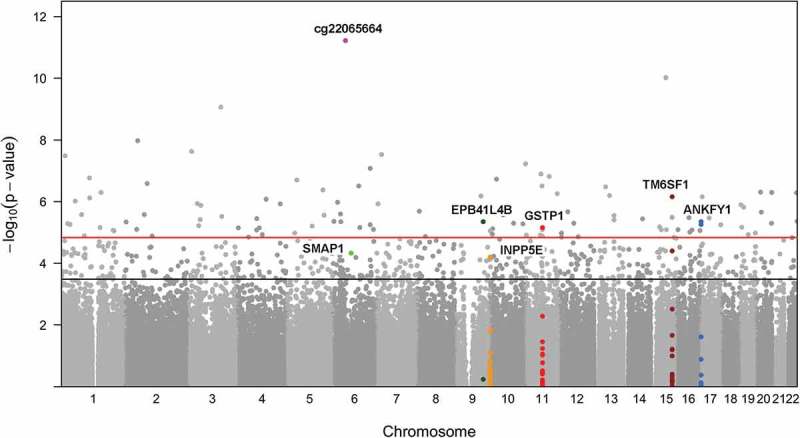
Figure 2.

Epigenome-wide Association Results between Maternal Lifetime Stress and Methylation of 365,193 CpGs Measured in Placenta for the Semi-Continuous Model. Each point represents the genomic location (x-axis) and the – log10 P values based on the semi-continuous model for association test (y-axis) for a single probe. Horizontal lines depict the epigenome-wide significance level corresponding to FDR = 0.05 (red) and FDR = 0.20 (black). The set of probes/genes highlighted in the text are indicated by red triangles.
