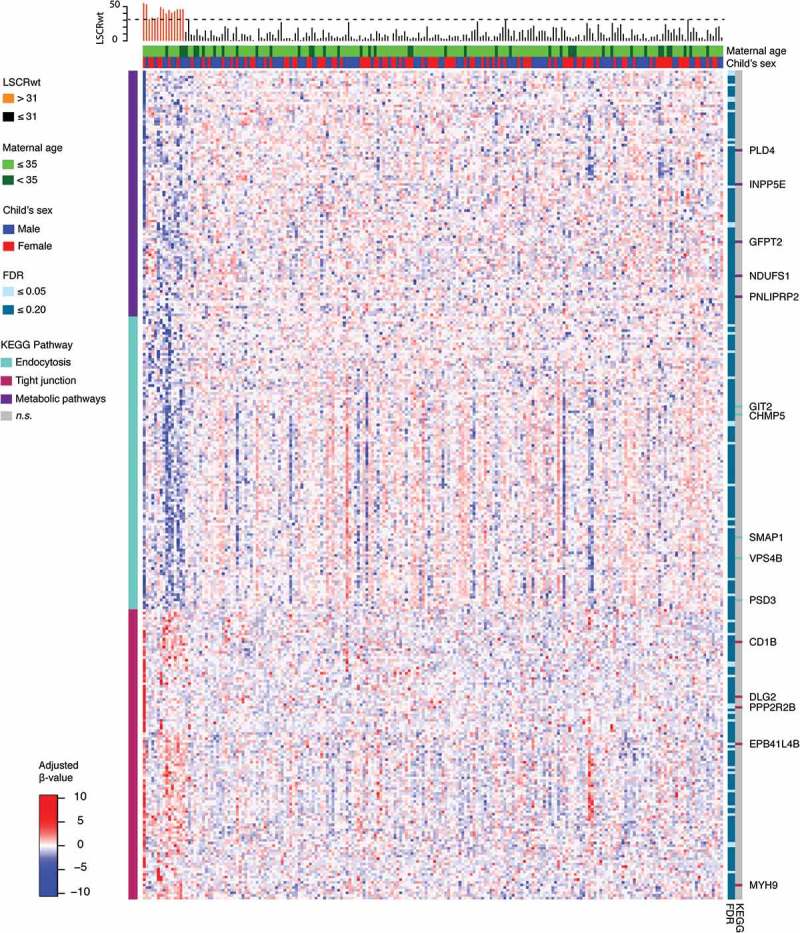
Figure 3.

Heatmap of M-values for 130 Gene-annotated Probes Significantly Associated with Maternal Lifetime Stress at the FDR = 0.10 Level. Heatmap shows adjusted and normalized methylationβ-values with genetic background and cell heterogeneity factors removed, for the leading three clusters that consist of 317 probes of the 616 significant probes (FDR = 0.20). For each gene/probe (rows), the cluster membership is shown in the bar to the left and the significance level based on the semi-continuous regression model is shown to the immediate right. Pathway enrichment testing was conducted for the probes belonging to each cluster; genes belonging to enriched KEGG pathways (P <0.05) are highlighted in the bars to the far right. For each sample (column), the LSCRwt is plotted (top) and the child’s sex and maternal age is shown in the bars directly above the heatmap.
