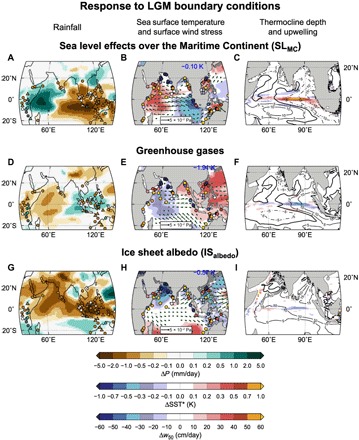
Fig. 2. Glacial drivers of IPWP hydroclimate change.

Annual mean climate response to (A to C) effect of lowered sea level on the geography of the Maritime Continent, (D to F) glacial concentrations of GHGs, and (G to I) ice sheet albedo. Maps show, from left to right, annual mean changes in rainfall, SST and surface wind stress (vectors), and upwelling (shading) and thermocline depth (contours). Overlaid circles show proxy-inferred changes in hydroclimate (left) and SST (center). The simulated and proxy SST change averaged over the domain was removed to emphasize the changes in horizontal gradients. The value of the simulated SST cooling averaged over the tropics (30°S to 30°N) is shown in blue. Upwelling is defined as the ocean vertical velocity at a 50-m depth. Thermocline depth is computed as the depth of the maximum vertical temperature gradient. Thermocline depth change contours are at 5-m intervals. Note the different proportions of the right panels focusing on the equatorial IO. The color schemes for relative SST and rainfall change are not linear.
