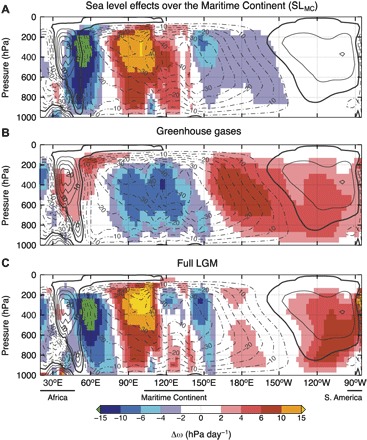
Fig. 3. Walker circulation response to LGM boundary conditions.

Changes in vertical velocity (ω) over the equatorial Indo-Pacific simulated by CESM1 in response to the following changes in boundary conditions at the LGM: (A) sea level effects over the Maritime Continent, (B) lowered GHGs, and (C) full LGM effects combined. Contours are annual mean ω simulated in the preindustrial control experiment. Vertical velocity values are averaged over the 10°S to 10°N latitude band. Contour intervals are 5 hPa day−1. Note that the color scale is not linear.
