
Fig. 4. Model-proxy agreement.
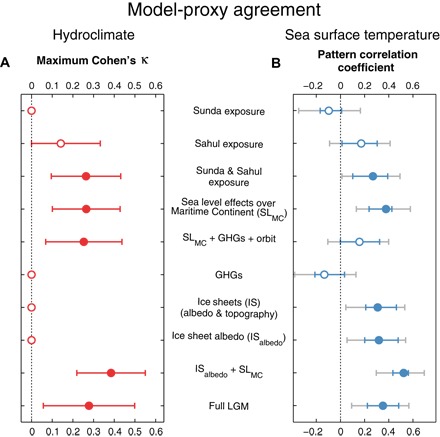
Maximum Cohen’s κ (left) and pattern correlation coefficient (right) for each climate response simulated by CESM1. Cohen’s κ quantifies agreement between simulated patterns of rainfall change and a multiproxy synthesis of hydroclimate change at the LGM. The maximum κ value obtained from the threshold sensitivity analysis is reported. The correlation coefficient (r) quantifies agreement between simulated patterns of SST change and our reconstruction of LGM temperature changes derived from Mg/Ca and records. A κ or r value of one indicates perfect model-proxy agreement. A value of zero indicates lack of agreement. Solid circles indicate statistically significant (P < 0.05) κ and r values. Error bars indicate the 95% confidence intervals for the κ values. Uncertainty due to calibration of SST proxies is reported as the minimum-maximum range of the r values computed using each reconstruction in our ensemble (blue error bars). The 95% confidence interval of the r values computed using the ensemble mean reconstruction is also shown (gray error bars). Further details on the computation of these proxy-model agreement estimators, as well as the definition of the climate responses, are provided in the Supplementary Materials.