
Fig. 1. The ensemble average of incidence of new infection, prevalence of infected agents, and cumulative infection temporal dynamics for simulated influenza in 2006, 2011, and 2016.
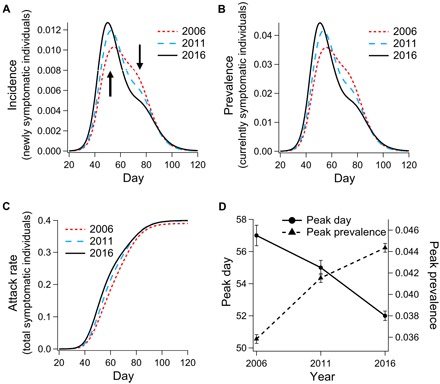
Comparison of simulation results for (A) incidence, (B) prevalence, (C) accumulated incidence (attack rate), and (D) trend in dynamics of peak day and prevalence; error bars (± SEM) designate standard error of the mean.