
Fig. 3. Analysis of bimodality in disease prevalence.
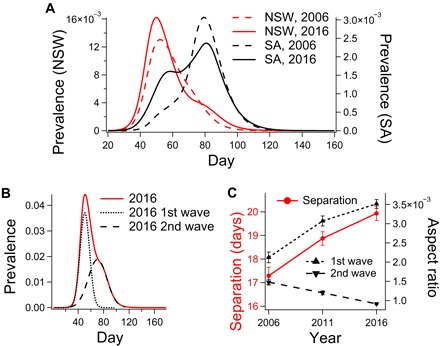
(A) The state-level prevalence for New South Wales (NSW) and South Australia (SA), comparing prevalence curves for 2006 and 2016. (B) National prevalence for 2016 and the two Gaussian curves used to fit the data. (C) Increasing interpeak separation, increasing aspect ratio of the first mode, and decreasing aspect ratio of the second mode (error bars: ±SEM).