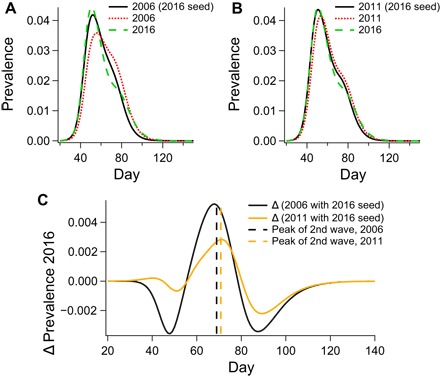
Fig. 5. The role of seeding.

(A and B) Raw prevalence curves demonstrating the effect of applying the seeding conditions of 2016 on the topologies of 2006 (A) and 2011 (B). (C) The residual between prevalence in 2016 and prevalence in 2006 (black curve) and 2011 (orange curve) when seeded with 2016 airport traffic. The dashed vertical lines in (C) indicate the maxima of Gaussian fits for the second epidemic wave.
