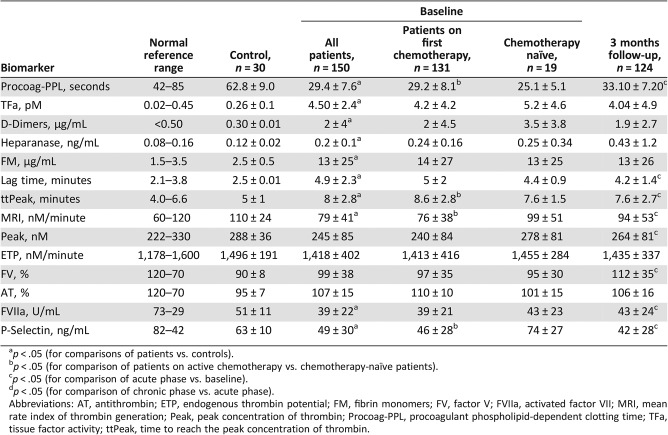
Table 3. Baseline profile and dynamic changes of the molecular biomarkers for hypercoagulability in patients enrolled in ROADMAP‐CAT study.
p < .05 (for comparisons of patients vs. controls).
p < .05 (for comparison of patients on active chemotherapy vs. chemotherapy‐naïve patients).
p < .05 (for comparison of acute phase vs. baseline).
p < .05 (for comparison of chronic phase vs. acute phase).
Abbreviations: AT, antithrombin; ETP, endogenous thrombin potential; FM, fibrin monomers; FV, factor V; FVIIa, activated factor VII; MRI, mean rate index of thrombin generation; Peak, peak concentration of thrombin; Procoag‐PPL, procoagulant phospholipid‐dependent clotting time; TFa, tissue factor activity; ttPeak, time to reach the peak concentration of thrombin.

