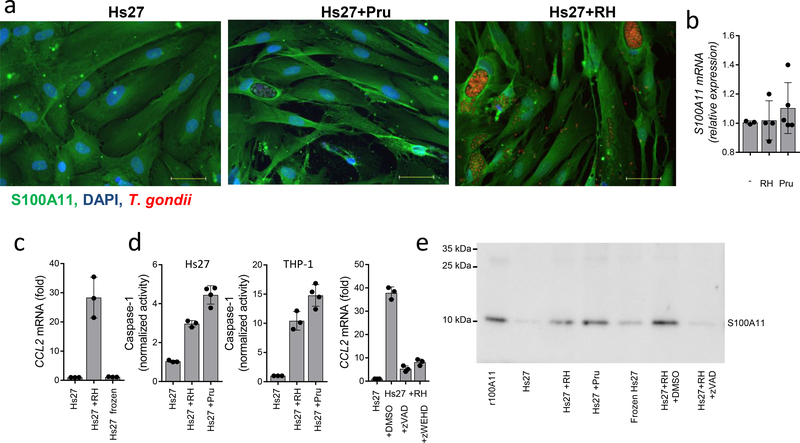
Figure 5.
Role of Caspase-1 in S100A11 release
Analysis of S100A11 protein levels in Pru or RH88-infected fibroblasts by (a) immunofluorescent detection and (b) by expression analysis. Scale bars, 50 μm. Error bars shown represent mean ± SD. (c) CCL2 expression by THP-1 cells stimulated with cell culture supernatants collected from frozen cells in comparison with RH88-infected cells. (d) Analysis of Caspase-1 activity in Hs27 and THP-1 cells infected with RH88 and Pru strains of T. gondii. CCL2 expression in THP-1 cells stimulated with cell culture supernatants collected from human Hs27 fibroblasts infected with RH88 alone or in the presence of zVAD (10 uM) or zWEHD (10 uM) for 72 hours was measured by qRT-PCR. (e) Detection of S1000A11 in cell culture supernatants collected from Hs27 cells, Hs27 cells infected with RH88 (Hs27+RH, MOI 3:1) or Pru (Hs27+Pru, MOI 3:1), Hs27 cells killed by rapid freezing (Frozen Hs27), or Hs27 cells infected with RH88 in the presence of zVAD (Hs27+RH+zVAD). Hs27+RH+DMSO represents an additional vehicle control supernatant for the zVAD-treated cells. Each symbol represents an individual experimental sample, (b-d) n=3 and n=4. The data shown are representative of (a-d) three and (e) five independent experiments, and error bars shown represent the mean ± SD.

