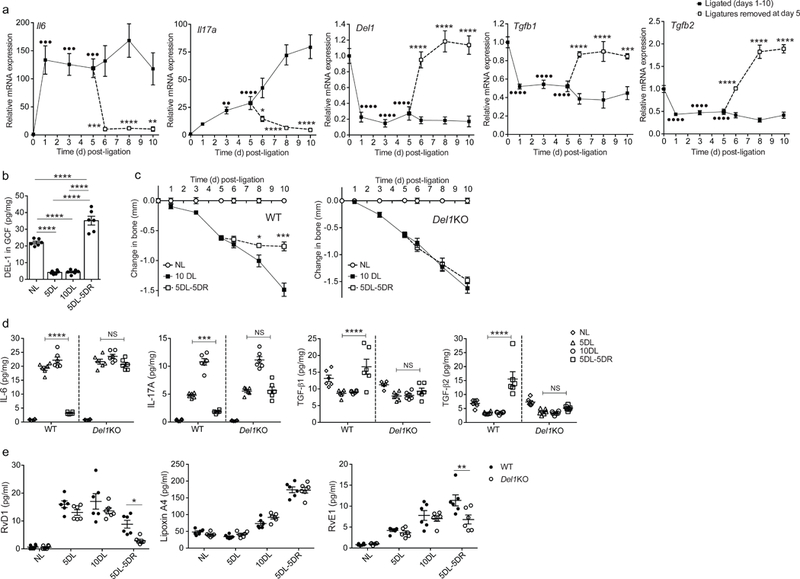
Fig. 2. The pro-resolution effect of DEL-1 in a resolving model of murine ligature-induced periodontitis (LIP).

(a) Wild-type mice were subjected to LIP for up to 10 days and ligatures were removed or not at day 5 (n = 5 mice per group per time point). Relative mRNA expression of the indicated molecules in gingival tissue was assayed by real-time PCR. Data were normalized to Gapdh mRNA and are presented as fold change relative to baseline, set as 1. (b) Wild-type mice were subjected to LIP for up to 10 days and ligatures were removed or not at day 5 (n = 6 mice per group per time point). Protein concentration of DEL-1 was measured by ELISA in GCF that was recovered from ligatures and data were expressed as pg per mg of total protein (NL, not ligated; 5DL, 5 days ligated; 10DL, 10 days ligated; 5DL-5DR, 5 days ligated and 5 days with ligatures removed). (c) Bone loss was measured in littermate wild-type (WT) or Del1KO mice that were subjected to LIP for up to 10 days with or without ligature removal at day 5 (n = 5 mice per group). (d,e) Wild-type (WT) or Del1KO littermate mice were subjected to LIP for up to 10 days and ligatures were removed or not at day 5 (n = 6 mice per group) (NL, not ligated; 5DL, 5 days ligated; 10DL, 10 days ligated; 5DL-5DR, 5 days ligated and 5 days with ligatures removed). (d) Protein concentrations of IL-6, IL-17A, TGF-β1 and TGF- β2 were assessed in gingival tissue by ELISA (pg/mg of total protein are shown). (e) Concentrations of RvD1, Lipoxin A4 and RvE1 were measured in GCF recovered from ligatures (pg/ml are shown). ••P < 0.01, •••P < 0.001, ••••P < 0.0001 vs. day 0 (baseline) (a), *P < 0.05, **P < 0.01, ***P < 0.001, ****P < 0.0001 vs. corresponding time-point without ligature removal (a, c) or between indicated groups (b, d, e). NS, non-significant. One-way ANOVA with Dunnett’s multiple comparisons test for comparison with baseline and two-way ANOVA with Sidak’s multiple comparisons test for comparisons with corresponding time-point without ligature removal (a); one-way ANOVA with Tukey’s multiple comparisons test (b); two-tailed Student’s t-test (c); two-way ANOVA and Tukey’s multiple comparisons test (d,e). Data are means ±SEM and are derived from one experiment with independent mice at each time point (a, c) or pooled from two experiments (b, d, e).
