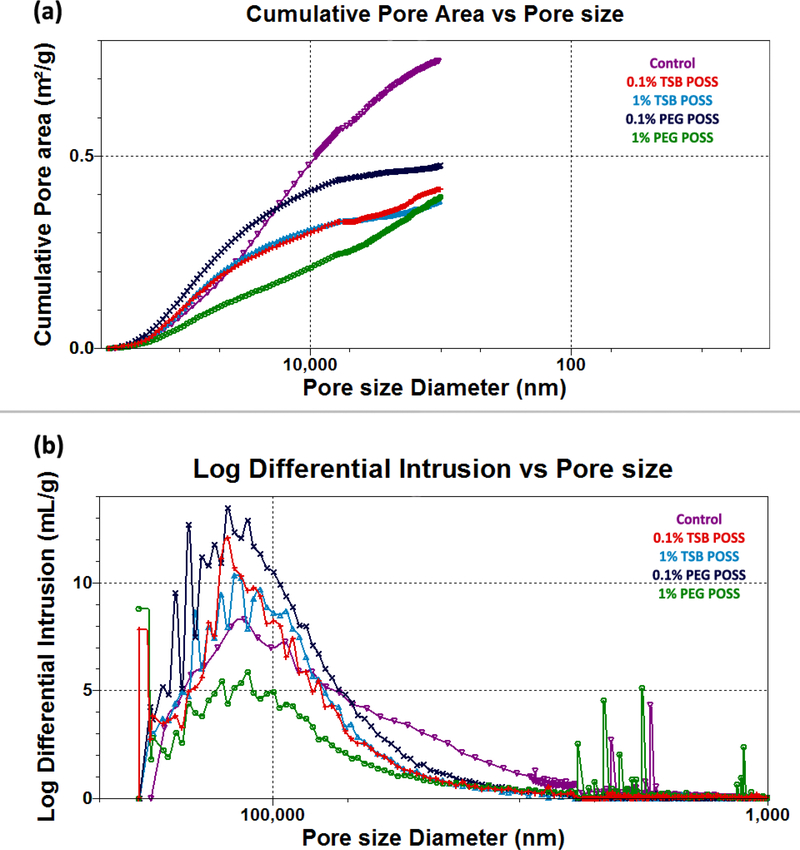
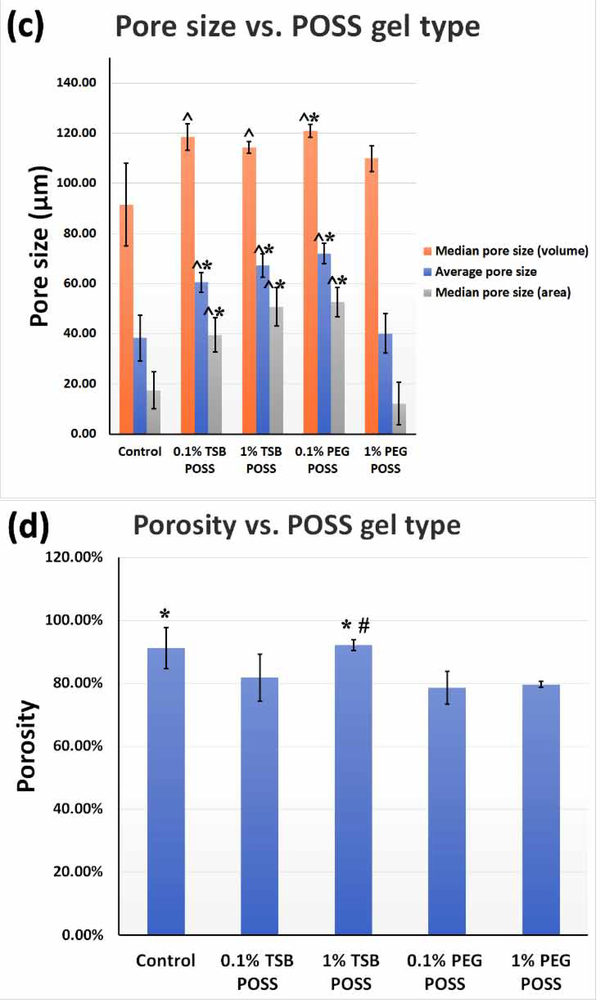
Figure 2. Characterization of hydrogel porosimetry.
(a) Cumulative pore area distribution with pore size. (b) Pore size distribution of POSS nanocomposite hydrogels. (c) Graph shows average and median pore sizes, respectively, corresponding to volume and surface area. ^: > control gel, p < 0.05, *: > 1% PEG POSS gel, p < 0.05. (d) Porosity of POSS nanocomposite hydrogels. *: > 1% PEG POSS gel, p < 0.05, #: > 0.1% PEG POSS gel, p < 0.05. All the curves presented in (a) and (b) are representative of the conditions tested. Variations among each replicate were too small to be represented). All numbers shown in (c) and (d) are weighted means and weighted standard deviations.


