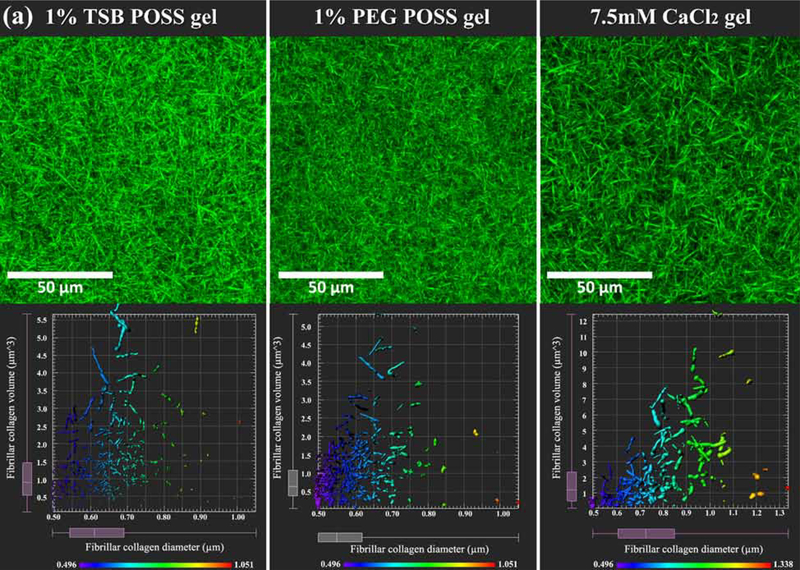
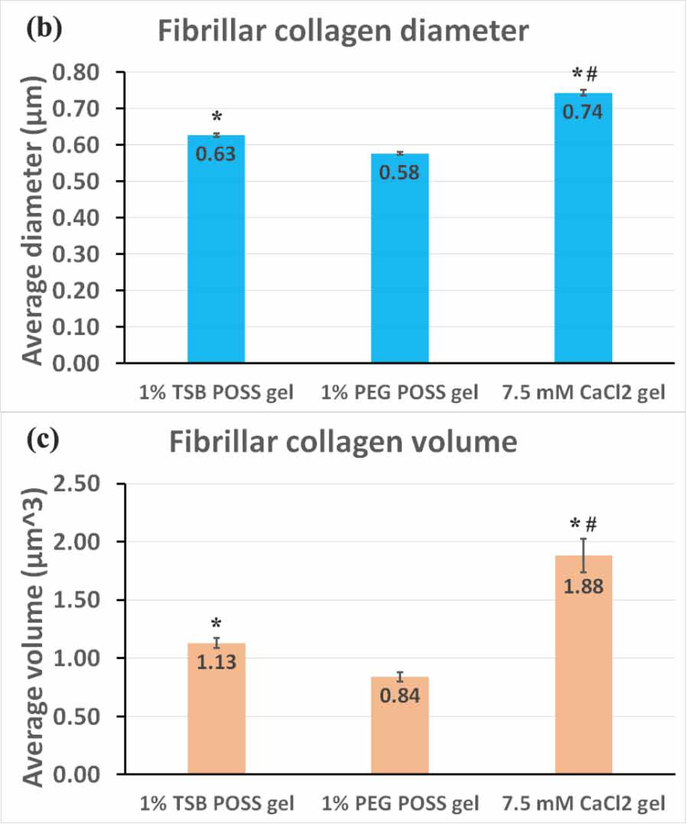
Figure 4. Microstructure of fibrillar collagen.
(a) Fibrillar collagen microstructure. Top row: Collagen fiber microstructure shown by second harmonic two-photon microscopy in nanocomposite hydrogel with 1% TSB POSS, 1% PEG POSS, or 7.5mM CaCl2 crosslinking. Bottom row shows corresponding quantification of collagen fibers within a 30 μm3 VOI segmented in Imaris software for each type of hydrogel. Plots show measurements of fiber diameter (x-axis) and volume (y-axis). The pseudocolor scale also indicates diameter of fibers. (b) Quantification of collagen diameter. *: > 1% PEG POSS gel, p < 0.05; #: > 1% TSB POSS gel, p < 0.05. (c) Quantification of collagen volume. *: > 1% PEG POSS gel, p < 0.05; #: > 1% TSB POSS gel, p < 0.05.


