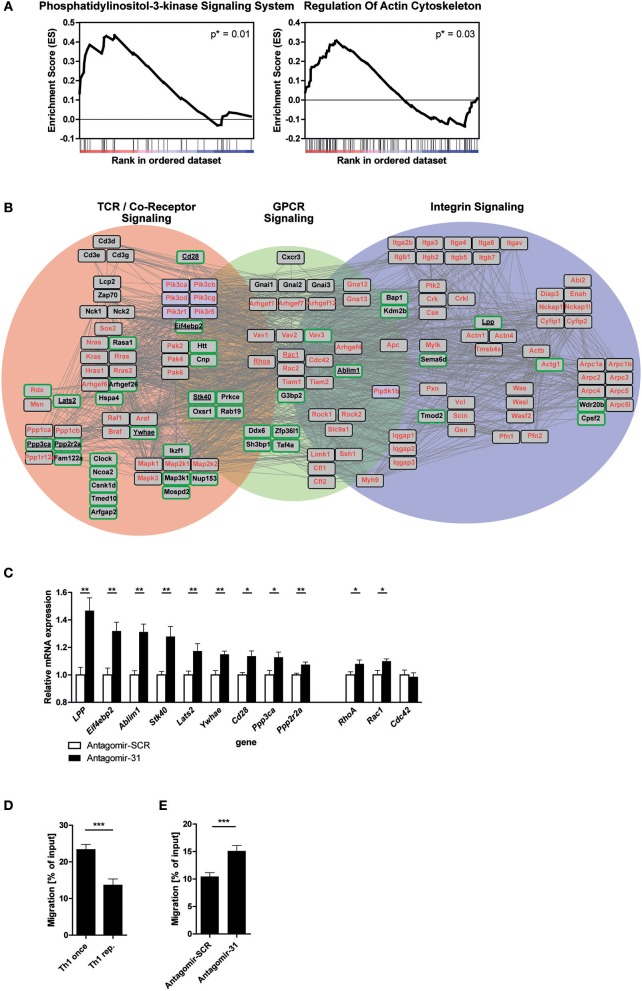
Figure 3.
MiR-31 targets a set of genes involved in cytoskeletal rearrangement and miR-31 inhibition increases the motility of Th1 rep cells. (A) GSEA of the transcriptome data obtained from Th1 rep cells 72 h after activation with αCD3/28 and treatment with Antagomir-31 or Antagomir-SCR with the KEGG-pathway database (v. 6.0) used as source for gene-sets. Data of two significantly enriched gene-sets is shown as enrichment curves with all genes in ranked order from most upregulated (left) to most downregulated (right). Nominal p-values are depicted in the figure. (B) Network of validated functional interactions among positively correlated miR-31 targets (green rimmed; Figure 2D) and the genes defining the gene set “regulation of actin cytoskeleton” (red). The resulting network was adapted to T cells (also see methods). Genes without interactions are not included. (C) QRT-PCR of target mRNA expression in reactivated Th1 rep cells 72 h after antagomir treatment relative to Hprt and normalized to Antagomir-SCR treated control. Data is shown as mean +SEM, n = 12 (for Lats2, RhoA, Stk40, Ywhae) pooled from four independent experiments, or n = 6 (for Ablim1, Cd28, Cdc42, Eif4ebp2, LPP, Ppp2r2a, Ppp3ca, Rac1) pooled from two independent experiments (Mann-Whitney test for unpaired data, **p ≤ 0.01, *p ≤ 0.05). (D,E) Transwell migration assays with an ICAM-1 coated membrane (10 μg/ml) and CXCL10 (100 ng/ml) in the lower compartment for once and repeatedly activated Th1 cells, 72 h after reactivation with αCD3/28 (D) and Th1 rep cells, 72 h after antagomir treatment and reactivation with αCD3/28 (E), assessed by flow cytometry, normalized to inserted cell number. Data is shown as mean +SEM, n = 16–18 pooled from four independent experiments (Mann-Whitney test for unpaired data, ***p ≤ 0.001).

