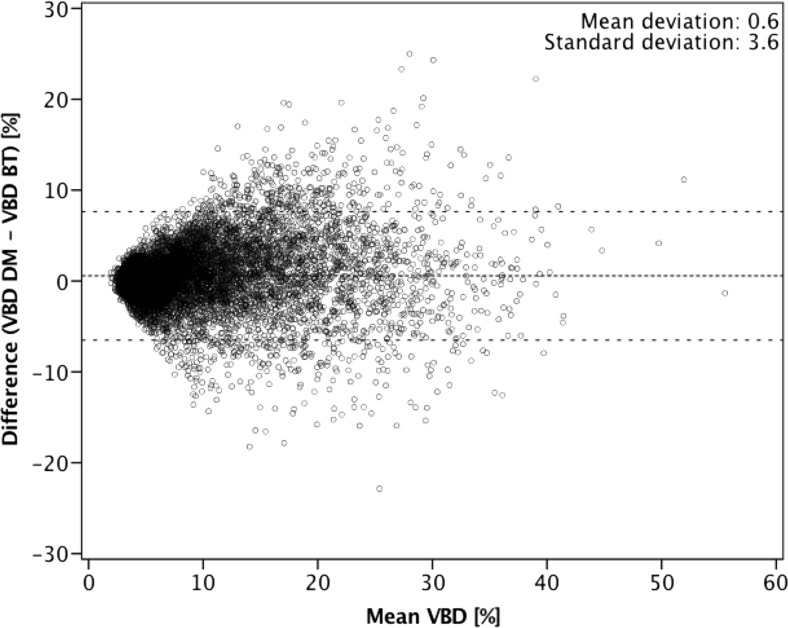
Fig. 2.
Bland–Altman plot of volumetric breast density (VBD) measured by digital mammography (DM) subtracted from that measured by breast tomosynthesis (BT) compared with the mean of the two results. The middle dashed line is the mean difference and the top and bottom dashed lines are the 95% limits of agreement (±two standard deviations)

