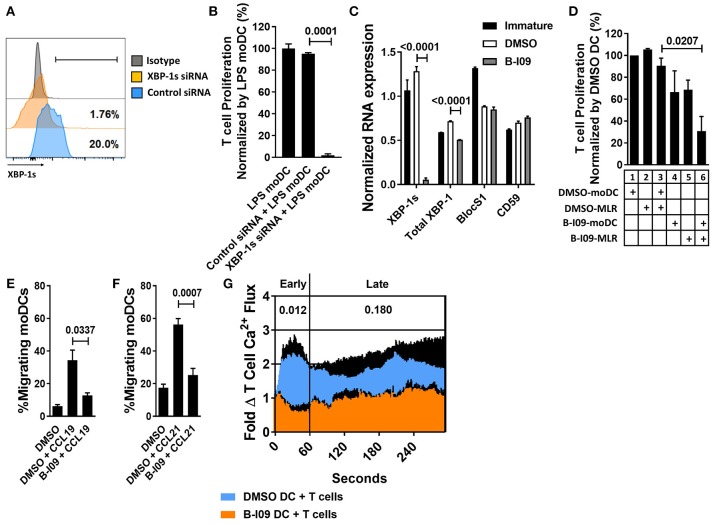
Figure 1.
XBP-1s inhibition reduces the stimulatory potency of moDCs toward allogeneic T cells. Human moDCs were stimulated with LPS (1 μg/ml) for 24 h in the presence of XBP-1 or control siRNA. (A) Representative histograms show XBP-1s expression in siRNA-treated moDCs. (B) T cells were stimulated by XBP-1- or control-siRNA-treated moDCs in alloMLRs. T cell proliferation (MTS colormetric assay) after 5 days is shown. AlloMLRs were plated in replicates of 5 at a moDC: T cell ratio of 1:30. 1 representative experiment of 2 independent studies is shown, Dunnett's test. (C) Human moDCs were stimulated with LPS (1 μg/ml) for 24 h in the presence of B-I09 (20 μM) or DMSO (0.1%). Bar graph shows triplicate mean XBP-1s or total XBP-1 mRNA, vs. the RIDD components BlocS1 and CD59 in B-I09- or DMSO-treated moDCs after 24 h of LPS stimulation as measured by RT-PCR. 1 representative experiment of 4 independent studies is shown, Tukey's test. (D) T cell proliferation (MTS colormetric assay) measured in 5-day MLRs using B-I09- or DMSO-treated allogeneic, moDCs. Table depicts whether moDCs were pre-treated with DMSO (0.1%) or B-I09 (20 μM), or if DMSO (0.1%) or B-I09 (20 μM) was added to the MLR medium. Replicate means from 4 independent experiments are shown, Dunnett's test. (E,F) Human moDCs were LPS-stimulated for 24 h with B-I09 or DMSO. Bar graphs show proportion of migrating moDCs in transwell assays testing CCL19 or CCL21 (300 ng/ml, 3 h) chemotaxis. Replicate means from 4 independent experiments are shown for each, Dunnett's test. (G) Human moDCs were stimulated with LPS (1 μg/ml) for 24 h in the presence of B-I09 (20 μM) or DMSO (0.1%), and then used to activate allogeneic T cells for 5 days. T cells were rested for 24 h at 37°C, loaded with Fluo-4 dye for 30 min, then restimulated with fresh B-I09- or DMSO-treated moDCs during live cell imaging to monitor calcium flux in real time. Replicate means from 3 independent studies are shown. P values are shown for early (<60 s) and late (>60 s) T cell calcium flux after initial moDC:T cell interaction by comparing the mean AUCs after stimulation with B-I09- or DMSO-treated moDCs, paired t-test.

