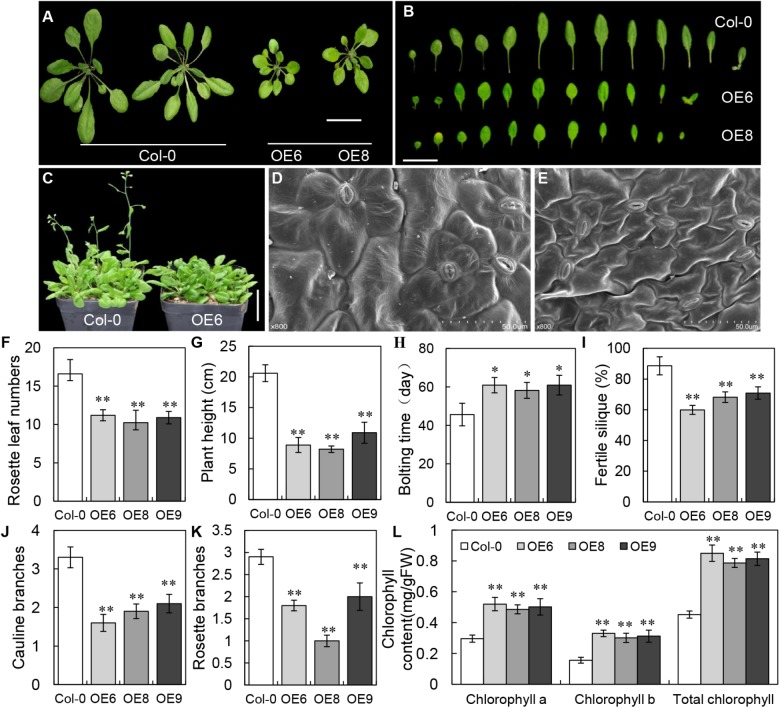
FIGURE 4.
Phenotypes of BrLAS-overexpressing transgenic plants and wild-type (WT) plants. (A) Comparison of transgenic T3 generation OE6 and OE8 and wild-type plants. The transgenic plants were smaller and had less rosette leaves. Bar = 1 cm. (B) Comparison of 30-day-old rosettes leaves from WT and transgenic plants. Bar = 1 cm. (C) Bolting and flowering in transgenic compared with WT plants. Both were delayed in the transgenic plants. Bar = 1 cm. (D,E) The size of leaf epidermis cells in transgenic (E) and WT plants (D). Cell size was significantly smaller in the transgenic plants. (F) Numbers of rosette leaves in the transgenic and WT plants before bolting. There were significantly less rosette leaves in the transgenic plants. (G) Plant height in the transgenic and WT plants at 65 days. A marked reduction was observed in the transgenic plants. (H) Bolting and flowering in the transgenic and WT plants. Both were delayed in the transgenic plants. (I) Fertility in the transgenic compared with WT plants. Reduced fertility was observed in the transgenic plants. (J,K) The number of rosette and cauline branches in the transgenic compared with WT plants. Both were reduced in the transgenic plants. (L) Chlorophyll contents in transgenic plants were increased compared with WT plants. Error bars represent the standard deviation of three independent experiments, and asterisks indicate a significant difference from the WT at ∗P < 0.05 and ∗∗P < 0.01.

