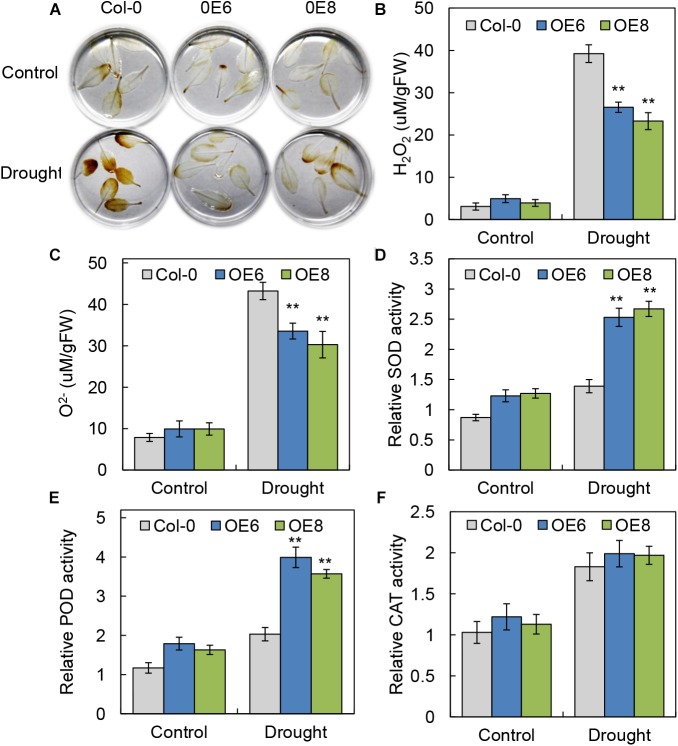
FIGURE 6.
BrLAS-overexpressing plants exhibited increased oxidative stress tolerance. (A) ROS accumulation in detached leaves using DAB staining to visualize H2O2 under normal and drought stress conditions. (B,C) Contents of H2O2 and O2- in transgenic plants and WT plants under normal and drought stress conditions. (D–F) Antioxidant enzyme activity in the transgenic and WT plants under normal and drought conditions. (D) SOD activity, (E) POD activity, and (F) CAT activity. Arabidopsis seedlings treated with water were used as a mock control. Error bars show the standard error between three replicates, and asterisks indicate significant differences from the WT at ∗∗P < 0.01.

