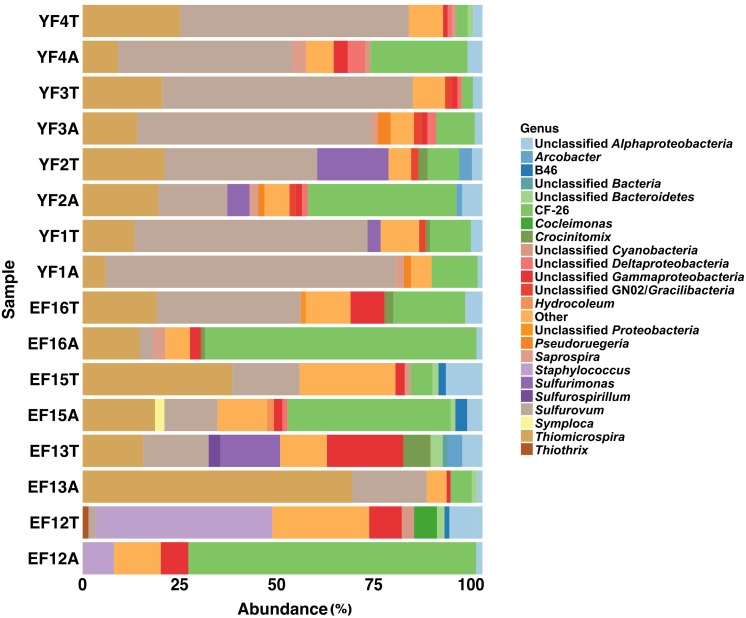
FIGURE 5.
Genus level distribution of 16S rRNA gene and transcript sequences recovered from EF and YF samples. Phylogenetic categories representing genera that account for at least 1% of overall abundance in all samples are shown. YF, Young Filaments; EF, Established Filaments; T, Total community (rRNA genes); A, Active Community (rRNA transcripts); the number for YF denotes the slide replicate, the number for EF denotes the sampling year.

