
FIGURE 1.
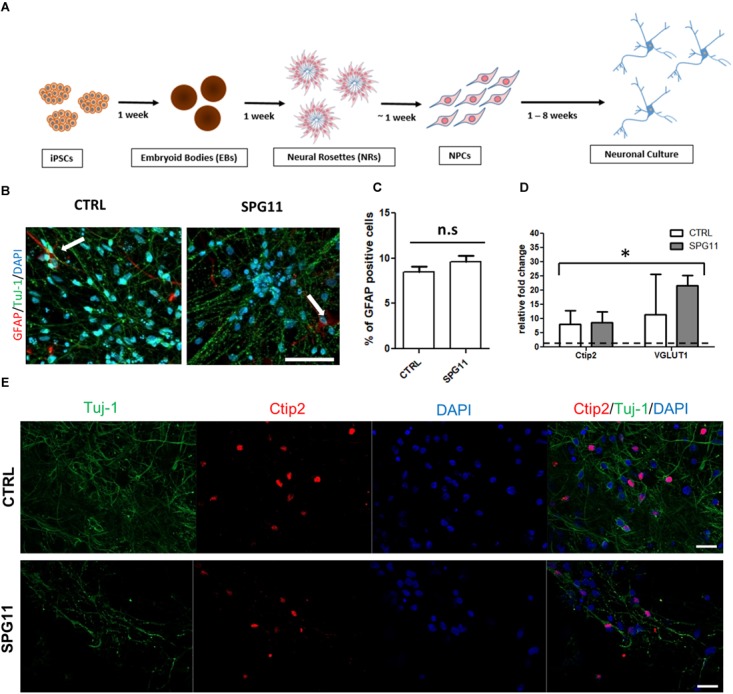
Neuronal differentiation and characterization (A) Schematic representation of the differentiation of iPSCs into neuronal cultures. (B) Representative images of CTRL (left; CTRL-1a) and SPG11 (right; SPG11-1b) 4 weeks differentiated neurons stained for GFAP and Tuj-1. (C) Quantification of percentage of GFAP+/DAPI+ cells in CTRLs and SPG11. (D) qPCR data of 4 weeks differentiated neurons. RNA from four different iPSCs clones was used as negative control and it is indicated as a dashed line at onefold change. (E) Representative images Ctip2 (red) and Tuj-1 (green) of CTRL and SPG11. Quantifications represent pooled data of CTRLs (CTRL-1, CTRL-2) and SPG11 (SPG11-1, SPG11-2, SPG11-3) neurons. iPSCs, induced pluripotent stem cells; NPCs, neural progenitor cells. Scale bar = 50 μm in (B) and 20 μm in (E). ∗P < 0.05.