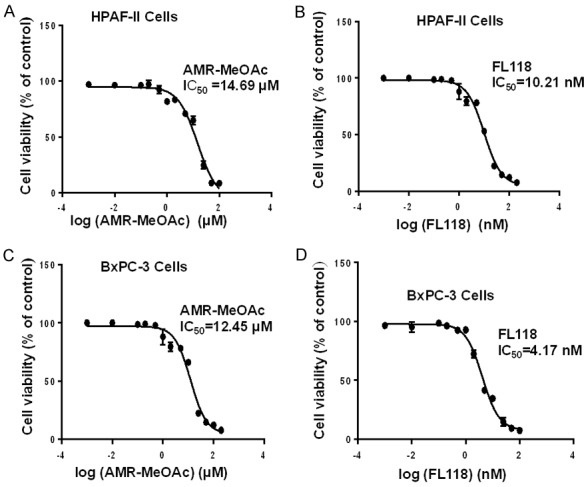
Figure 2.

Antiproliferative activity of AMR-MeOAc and FL118 in pancreatic cancer cells. A and B are HPAF-II cell viability curves upon treatment with AMR-MeOAc and FL118, respecitvely. C and D are BxPC-3 cell viability curves upon treatment with AMR-MeOAc and FL118, respectively. Their corresponding IC50 are shown.
