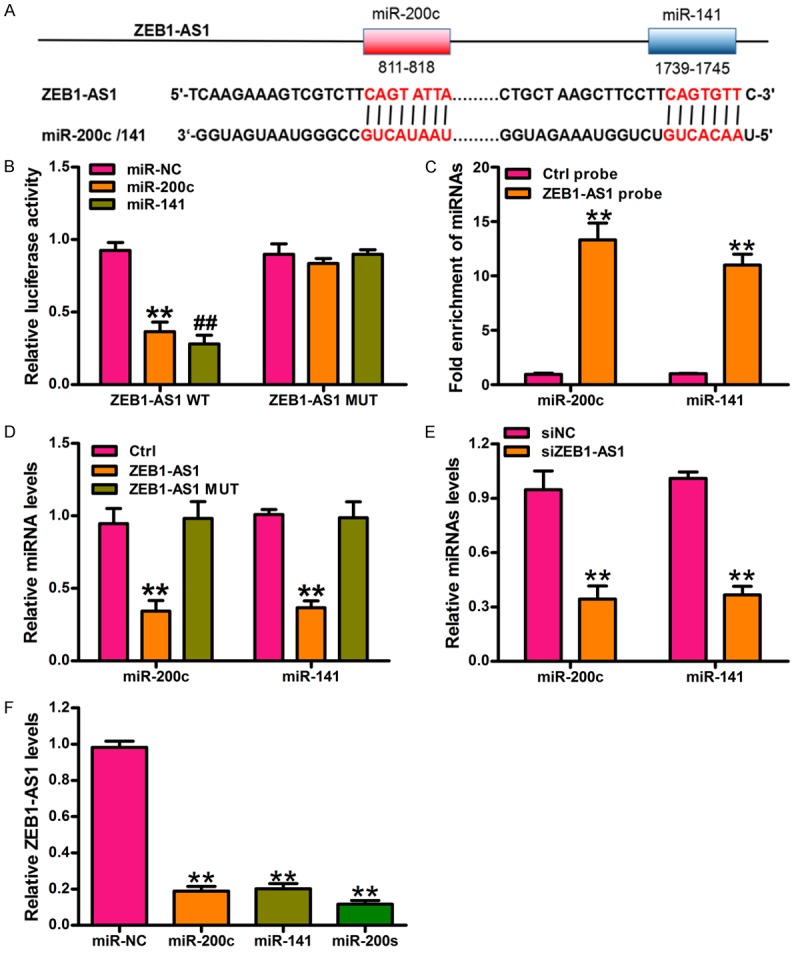
Figure 3.

ZEB1-AS1 negatively regulates miR-200s in glioma cancer cells. A. The potential binding sites of miR-200c/141 and ZEB1-AS1 is predicted by using the TargetScan algorithm. B. Luciferase activity in U87 cells cotransfected with miRNA mimics or the miRNA negative control and luciferase reporter containing ZEB1-AS1 wild type (ZEB1-AS1-WT) or miR-200c/141 binding sites mutated ZEB1-AS1 (ZEB1-AS1-Mut). Results are shown as the relative ratio of firefly luciferase activity to renilla luciferase activity. **P < 0.01, miR-200c versus miR-NC group, ##P < 0.01, miR-141 versus miR-NC group. C. miR-200c and miR-141 were significantly enhanced by RNA immunoprecipitation (RIP) assay in the ZEB1-AS1 group compared with control. **P < 0.01, ZEB1-AS1 probe versus Ctrl probe. D. The expression level of miR-200c and miR-141 was measured by qRT-PCR in U87 cells transfected with ZEB1-AS1-WT or ZEB1-AS1-Mut or controls. **P < 0.01, ZEB1-AS1-WT versus Ctrl. E. The expression level of miR-200c and miR-141 was measured by qRT-PCR in U87 cells transfected with siZEB1-AS1 or siNC. **P < 0.01, siZEB1-AS1 versus siNC. F. ZEB1-AS1 expression was measured by qRT-PCR in U87 cells transfected with miR-200c or miR-141 or miR-200s. **P < 0.01, miRNA mimics versus miR-NC group. Ctrl: control; siNC: siRNA negative control; miR-200s: the mixtures of miR-200c and miR-141. All values are expressed as mean ± SD of three replicates.
