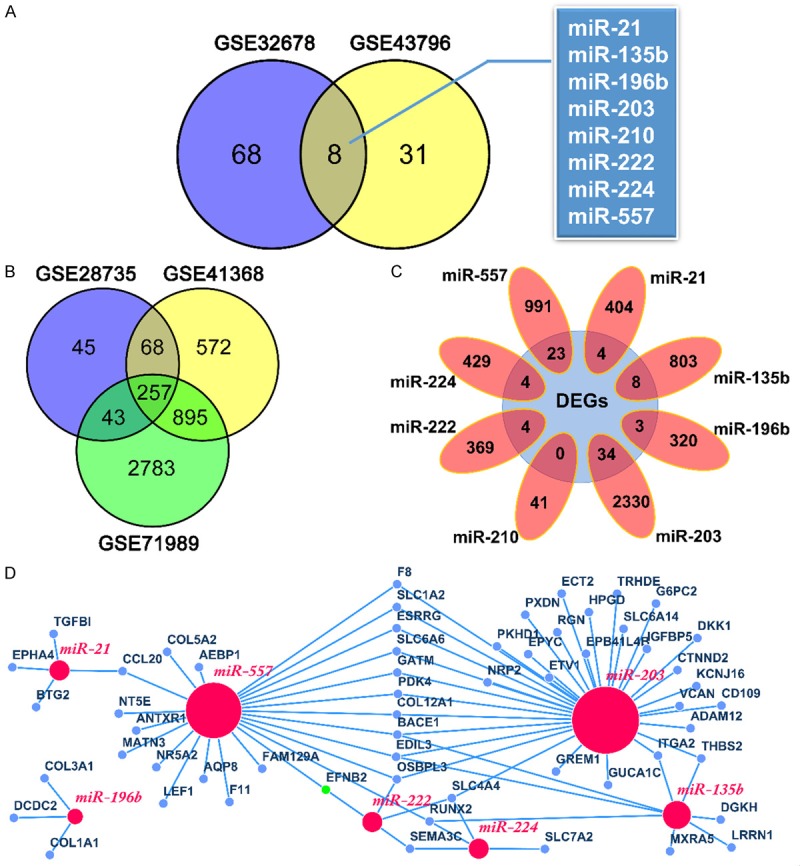
Figure 1.

Identification of DEMs and DEGs, and construction of the miRNA-mRNA regulation network in PDAC. A. A total of 8 common DEMs were screened were obtained from GSE32678 and GSE43796. B. A total of 257 shared DEGs were identified from GSE28735, GSE41368 and GSE71989. C. Eight target gene datasets intersected with 257 DEGs, respectively. D. The regulatory network between miRNAs and target genes was visualized by the Cytoscape. Red nodes represent miRNAs and blue nodes represent genes. DEMs, differentially expressed miRNAs.DEGs, differentially expressed genes.
