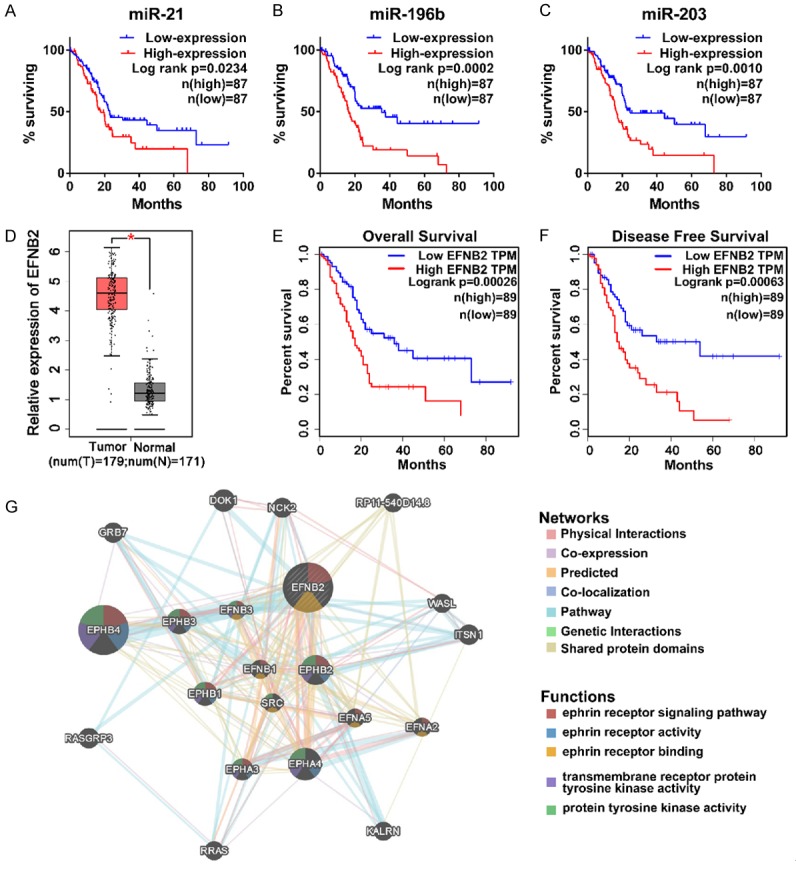
Figure 3.

Screening of potential indicators associated with prognosis in PDAC. A-C. The overall survival curves of miR-21 (P=0.0234), miR-196b (P=0.0002) and miR-203 (P=0.0010). Patients were divided into low- and high-expression group according to median value. Both low- and high-expression groups contain 87 patients with PDAC. D. The expression level of EFNB2 between PDAC samples (n=179) and normal pancreatic samples (n=171). P<0.05. E, F. The overall survival and disease free survival curves of EFNB2 (P=0.00026 and P=0.00063, respectively). Both low- and high-expression groups contain 89 patients with PDAC. TPM, transcripts per million. G. The function of EFNB2 and relevant networks with other genes were predicted by geneMANIA.
