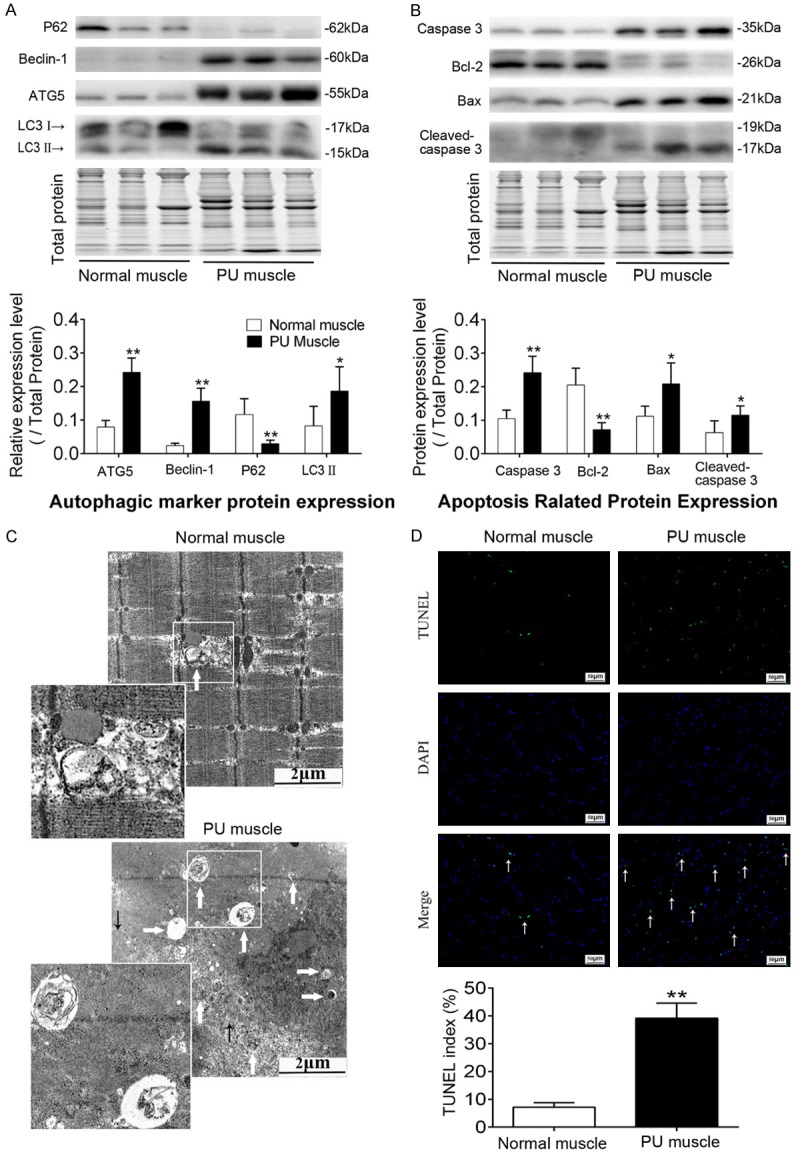
Figure 2.

Elevations in autophagy and apoptosis in deep PU muscle tissue compared with normal muscle. A. Representative immunoblot images and relative quantification of P62, Beclin1, ATG5 and LC3, collectively as an index of autophagy level. B. Representative immunoblot images and relative quantification of Bcl-2, Bax, Caspase 3 and cleaved Caspase 3, collectively as an index of apoptosis level. TGX Stain-Free™ FastCast™ Acrylamide Gel was performed to assess the total amount of protein expression, which was used for normalization. C. Transmission electron micrographs of autophagosomes in normal and PU muscle samples. Insets are higher magnification. White thick arrows and black thin arrows indicate autophagosomes and myofilament, respectively. D. Up panel: photomicrographs of TUNEL staining for normal and PU muscles, white thin arrows show TUNEL-positive nuclei; Down panel: quantitative analysis of the number of apoptotic cells, shown as TUNEL index. The scale was shown in corresponding picture, (n = 5-8; Means ± SD; *P < 0.05, **P < 0.01).
