Figure 3.

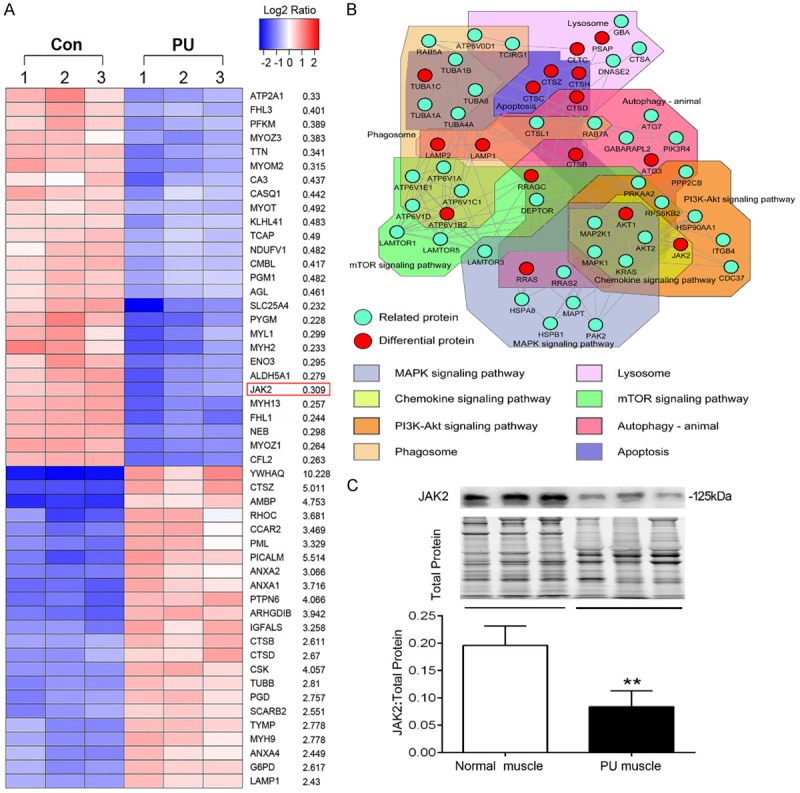
The protein expression profile of deep PU muscle and western blot validation. A. Heat map exhibiting a part of the significantly differentially expressed proteins in PU muscle compared with normal muscle. Peptide levels were from the proteomics analysis, P < 0.05 and fold change ≥ 2 were the cut-off (in order of P value). B. The protein-protein interaction network of autophagy- and apoptosis-associated proteins obtained from the STRING database with a confidence score of ≥ 0.7 containing 54 nodes and 146 edges, with pathway analysis of those proteins. C. Representative immunoblot images and relative quantification of JAK2 for PU muscles and normal muscles. TGX Stain-Free™ FastCast™ Acrylamide Gel was performed to assess the total amount of protein expression, which was used for normalization (n = 5-8; Means ± SD; **P < 0.01).
