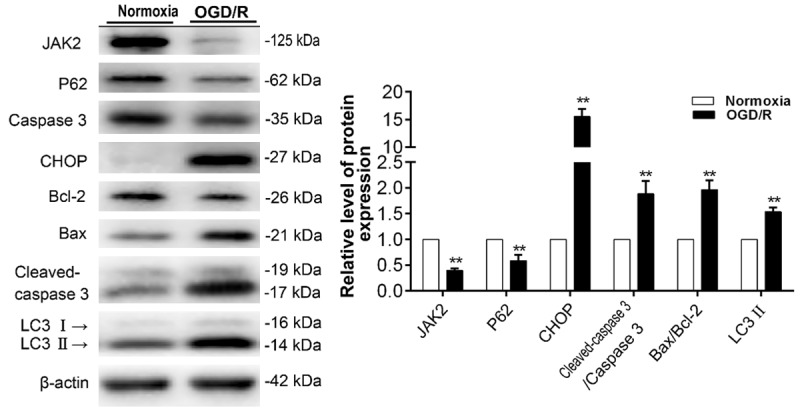
Figure 4.

Autophagic and apoptotic response induced by OGD/R in mouse C2C12 myoblast cells. Representative immunoblot images and relative quantification of JAK2, P62, Caspase 3, CHOP, Bcl-2, Bax, cleaved Caspase 3, LC3 and β-actin in C2C12 myoblasts treated with normoxia (control group) and OGD/R. Quantification expressed as fold induction over control group (assumed as 1), data were determined by densitometric analysis from at least 3 independent experiments after normalization by β-actin (Means ± SD; **P < 0.01 versus control group).
