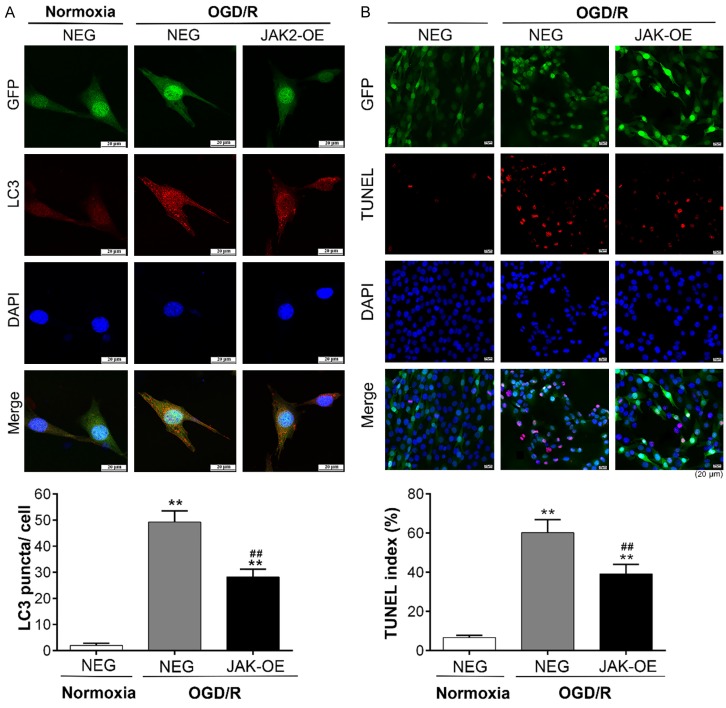
Figure 6.
Immunofluorescence analysis of LC3 expression and TUNEL staining. The cells were transfected with EGFP-tagged lentivirus carrying JAK2 plasmid (JAK2-OE) or a negative control plasmid (NEG). A. Representative immunofluorescent photographs of LC3 expression in C2C12 myoblasts after normoxia (control group) or OGD/R treatment, and quantitative analysis was conducted to count the number of LC3-positive puncta per cell. B. Representative photomicrographs of TUNEL-stained C2C12 myoblast cells after normoxia (control group) or OGD/R treatment, and quantitative analysis of the number of apoptotic cells was shown as TUNEL index for different groups. The data were derived from three independent experiments (Means ± SD; **P < 0.01 versus control group; ##P < 0.01 versus NEG+OGD/R group).

