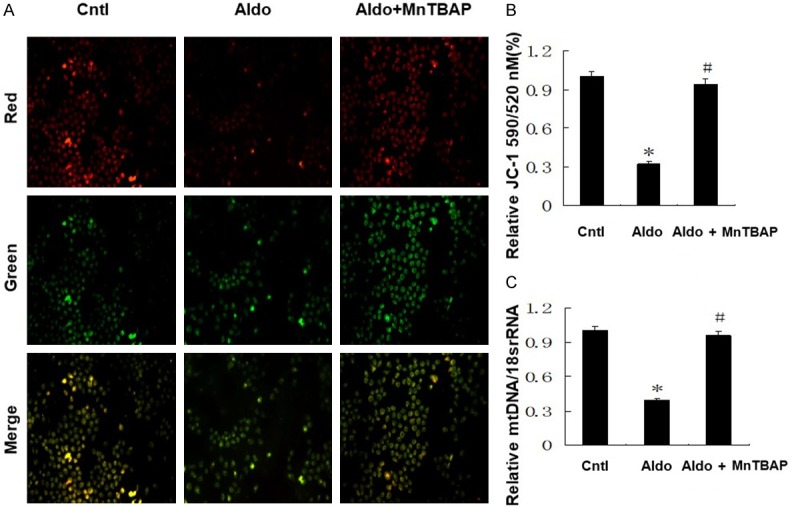
Figure 1.

Effects of MnTBAP on Aldo induced MtD. Cells were pretreated with MnTBAP (100 µM) for 30 min, followed by incubation with Aldo (100 nM) for 24 h. A: Representative images of JC-1 staining (×400). B: Quantitation of JC-1 fluorescence by flow cytometry. C: mtDNA copy number following MnTBAP treatment. Data represented as the mean ± SEM (n = 6). *P < 0.01 vs Control; #P < 0.01 versus Aldo-induced group.
