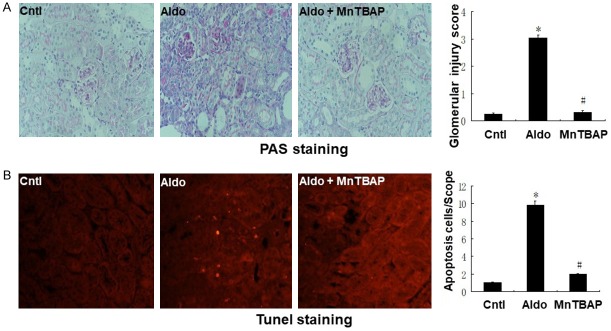
Figure 4.
Effects of MnTBAP on Aldo infused renal injury on day 28. A: Representative photomicrographs of Periodic acid-Schiff-stained kidney sections (magnification, ×400); B: Representative images of TUNEL staining are shown (magnification, ×400). Bar graph indicates glomerular injury score and the mean number of TUNEL-positive tubular cells per field. Data represented as the mean ± SEM (n = 6). *P < 0.01 vs Control; #P < 0.01 versus Aldo-induced group.

