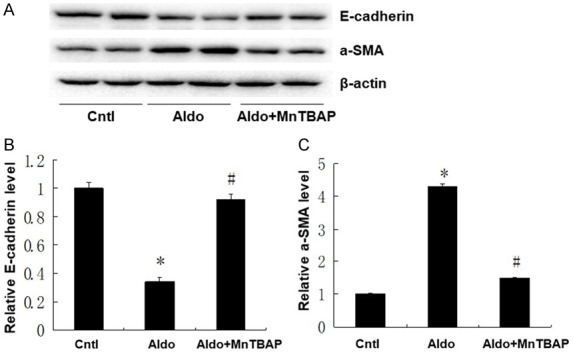
Figure 5.

Effects of MnTBAP on Aldo infused cell phenotypic alteration. (A) Expression of α-SMA and E-cadherin protein detected in kidney samples from different groups; Semi-quantitative analysis of E-cadherin (B), and α-SMA (C) normalized against β-actin. Data represented as the mean ± SEM (n = 6). *P < 0.01 vs Control; #P < 0.01 versus Aldo-induced group.
