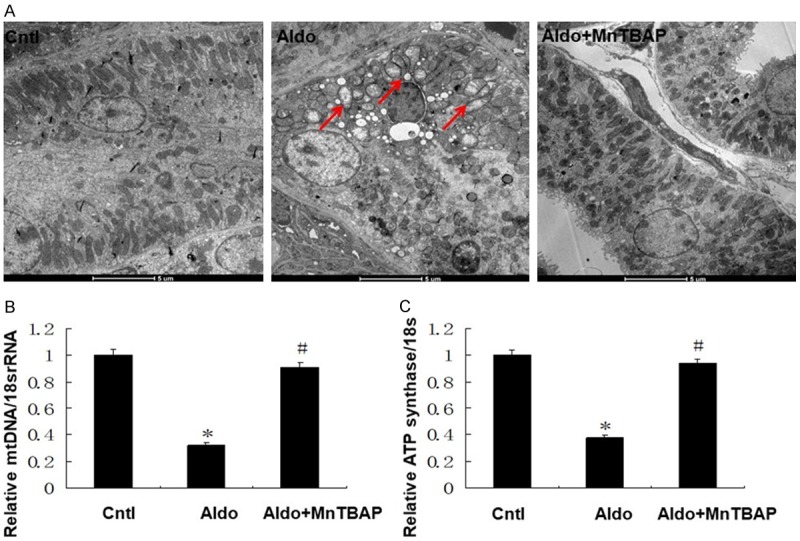
Figure 6.

Effects of MnTBAP on Aldo infused mitochondrial dysfunction. Representative electron microscopy photomicrographs of ultrastructural morphology of mitochondria (A), (magnification ×2100). Arrow indicates swollen mitochondria. Semi-quantitative analysis of mtDNA (B) and ATP synthase mRNA (C) expression normalized against 18S performed by real-time PCR. Data represented as the mean ± SEM (n = 6). *P < 0.01 vs Control; #P < 0.01 versus Aldo-induced group.
