
Table 3.
Identification of HLA-E binding 9-mer peptides.
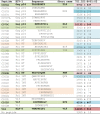 |
LCL 721.221 cells overexpressing HLA-E*01:03 were pulsed with indicated 9-mer peptides and the surface HLA-E*01:03 stabilization was determined using flow cytometry. Expression is shown as MFI. Please see gating strategy in Fig. S5. MFI data are shown as mean ± SD (n = 3). Colour coding: MFIs:  3380–3999;
  4000–4999;
  5000–5999;
  6000–6999;
  over 10,000;
  over 14,000.
  Positive and
  no stabilization in the SCT assay. Bold: confirmed HLA-E*01:03 binder peptides in two assays (MFI > 4000). (For interpretation of the references to colour in this table legend, the reader is referred to the web version of this article).