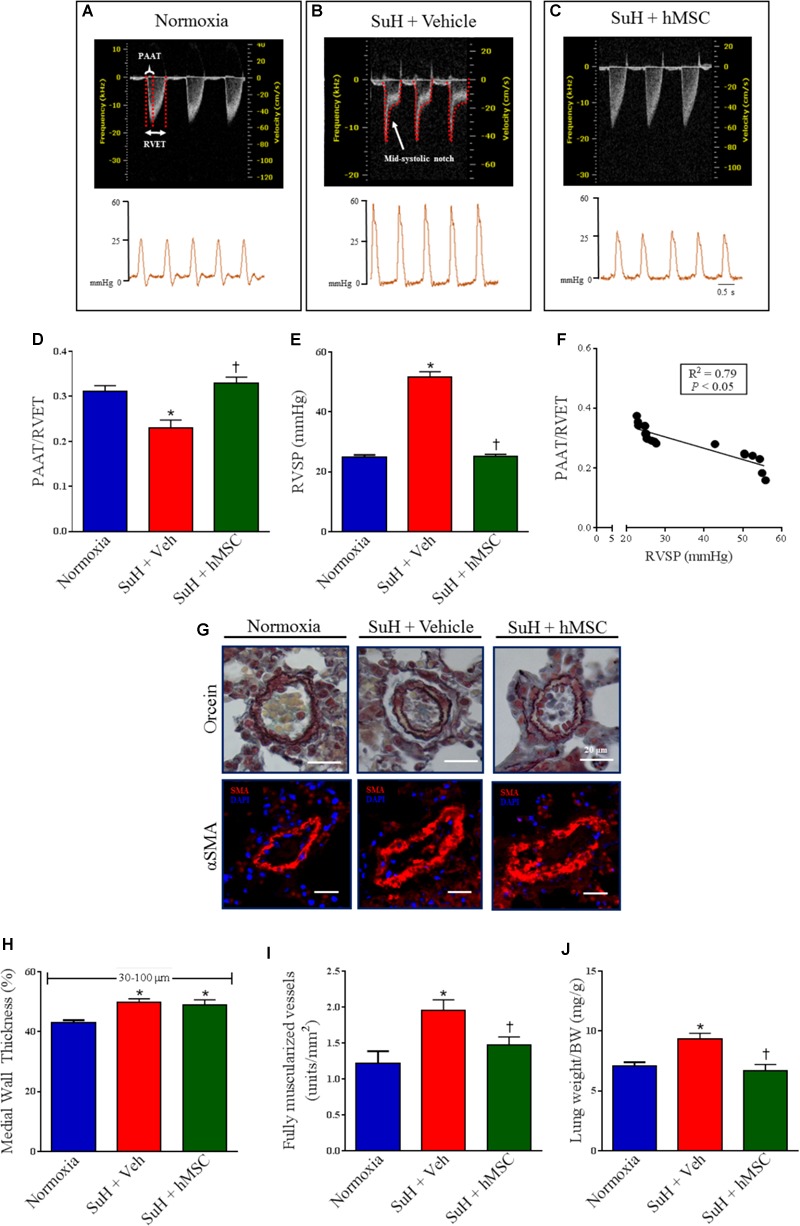
FIGURE 2.

Effects of the hMSC therapy in the pulmonary vascular changes observed in SuH-PAH mice. (A–C) Representative images of PA outflow profile (upper) are presented for all groups 28 days after protocol initiation. Lower images are representative tracings of RVSP at day 29 of protocol. (D) Ratio between PAAT and RVET; (E) RVSP, and (F) linear regression between PAAT-to-RVET ratio and RVSP. (G) Representative orcein and immunostaining for α-SMA of the distal PAs exposed to normoxia or SuH protocol for 4 weeks. (H) Vessel wall thickness expressed as a percent of the total area of the vessel ranging between 30 and 100 μm in external diameter, (I) total of fully muscularized vessels, and (J) lung weigh-to-body weight ratio. Data represent the mean ± SEM (n = 5–7 mice per group). ∗P < 0.05 compared with normoxia group; †P < 0.05 compared with SuH group treated with vehicle. Ordinary one-way ANOVA with multiple comparisons. hMSC, human mesenchymal stem-cell; SuH, SU5416/hypoxia; PAH, pulmonary arterial hypertension; PA, pulmonary artery; RVSP, right ventricular systolic pressure; PAAT, pulmonary artery acceleration time; RVET, right ventricle ejection time; α-SMA, alpha smooth muscle actin.
