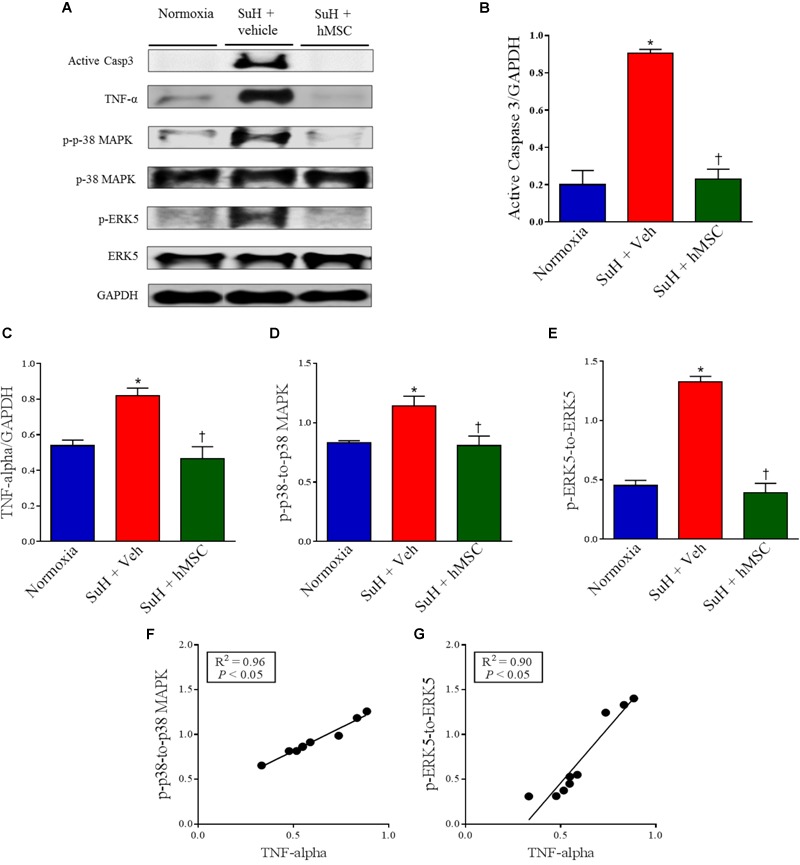
FIGURE 4.

Effects of SuH model on the lung protein expression over 29 days of protocol and intravenous treatment with vehicle or hMSC at day 14 of protocol. (A) Shows the Western blot analyses of active caspase 3, TNF-α, p-p38 MAPK, p-38 MAPK, p-ERK5 and ERK 5 in lungs from normoxia or SuH mice, respectively. GAPDH was used for normalization. (B) Quantification of active caspase 3 expression. (C) Quantification of TNF-α. (D) Relative expression ratio of p-p-38 MAPK to p-38 MAPK and (E) relative expression of p-ERK5 to ERK5, respectively. (F) Linear regression between p-p-38 MAPK to p-38 MAPK ratio and TNF-α expression and (G) linear regression between p-ERK5 to ERK5 ratio and TNF-α expression. Each column and bar represent the mean ± SEM (n = 3–7 mice per group). P < 0.05 compared with normoxia group; †P < 0.05 compared with SuH group treated with vehicle. Ordinary one-way ANOVA with multiple comparisons. hMSC, human mesenchymal stem-cell; SuH, SU5416/hypoxia; Active casp 3, active caspase-3; TNF-α, tumor necrosis factor alpha; p-p-38 MAPK, phosphorylated P-38 MAPK; p-38 MAPK, p-38 mitogen-activated protein kinase; p-ERK5, phosphorylated extracellular-signal-regulated kinase 5; ERK5, extracellular-signal-regulated kinase 5.
