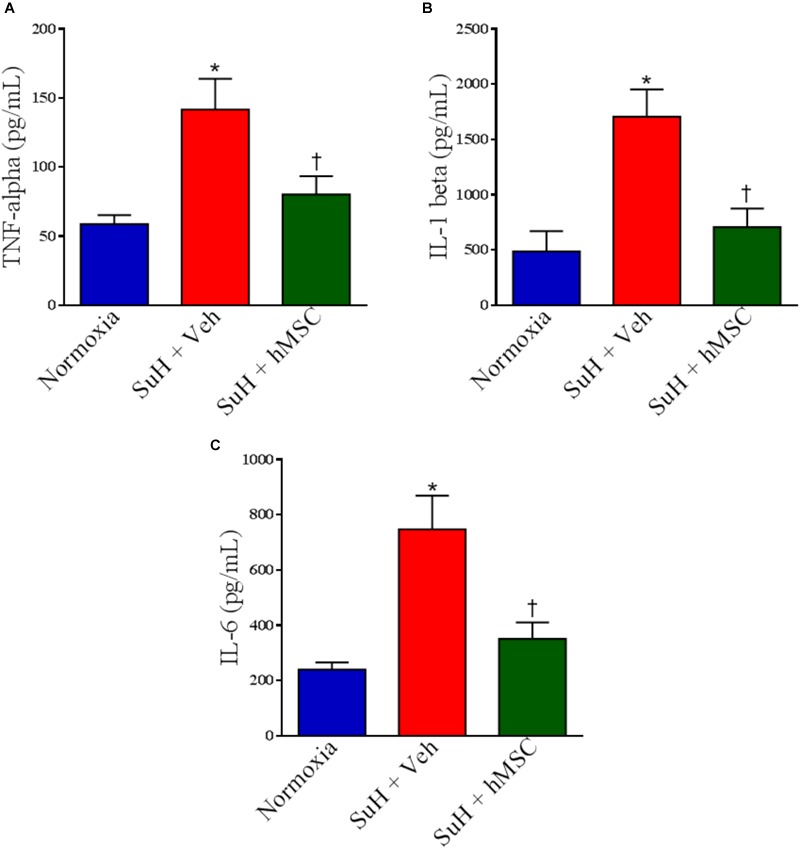
FIGURE 8.

Effects of SuH model on the cytokine levels measured by ELISA assessment in RVs from experimental groups. (A) Levels of TNF-α, (B) levels of IL-1β, and (C) levels of IL-6. Each column and bar represent the mean ± SEM (n = 3–7 mice per group). ∗P < 0.05 compared with normoxia group; †P < 0.05 compared with SuH group treated with vehicle. Ordinary one-way ANOVA with multiple comparisons. hMSC, human mesenchymal stem-cell; SuH, SU5416/hypoxia; TNF-α, tumor necrosis factor alpha; IL-1β, interleukin-1 beta, IL-6, interleukin-6.
