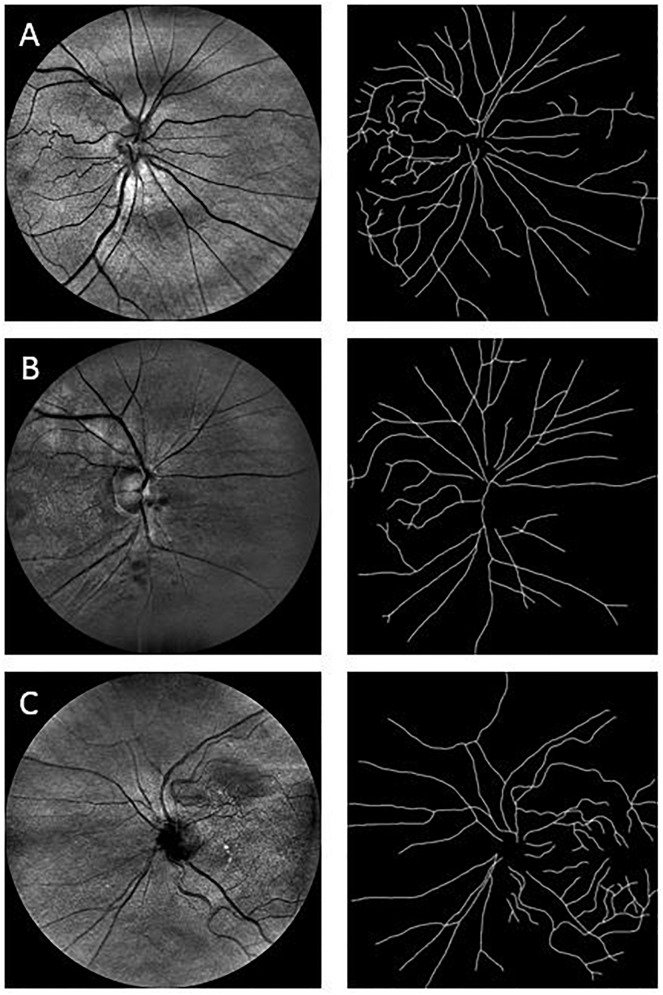
FIGURE 2.
Sample images used in the fractal analysis. Images in the left column are the raw images obtained with the EasyScan system, while those in the right are their respective skeleton images that were used in the fractal analysis. Row (A) is from a healthy cognitively individual (MoCA score range: 29.6–25.2), Row (B) is from an MCI subject (MoCA score range: 25.2–19), and Row (C) is from a participant with more cognitive deterioration than MCI (MoCA score range: 21 to 11.4). MoCA, Montreal Cognitive Assessment.

